
7 Oct 2025
🔥 Day 21 — Effective Python Coding Series
Today’s focus: Classes 🐍
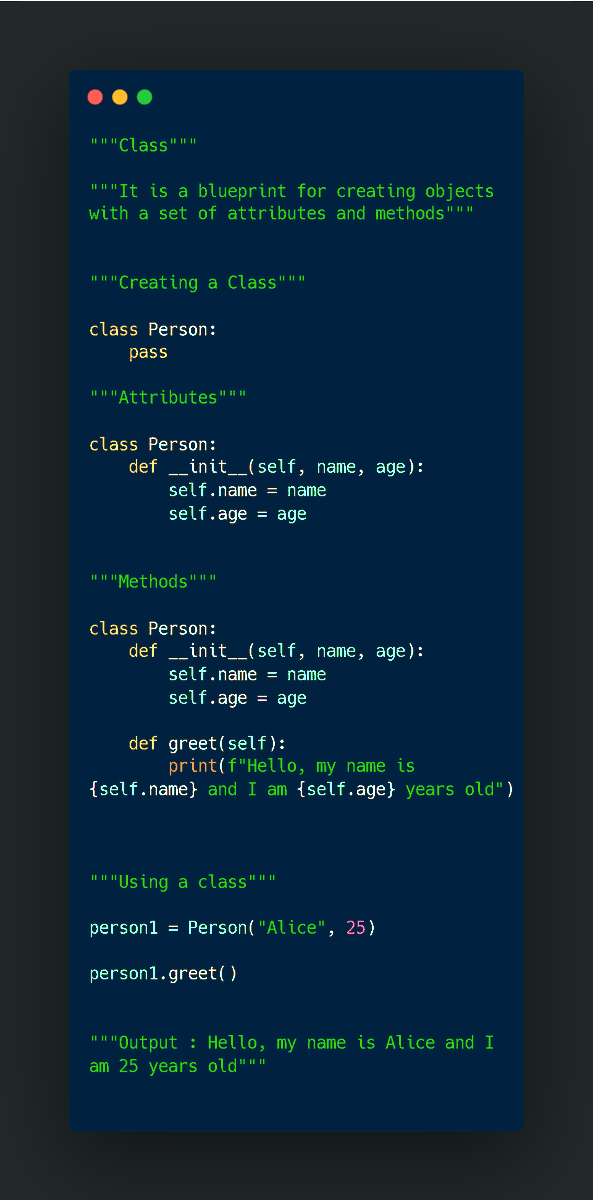
In Python, a class is a blueprint for creating objects — combining data (attributes) and behavior (methods) into one logical unit.
Think of it as a way to structure your code to model real-world entities more efficiently.
✨ How it works:
You define a class with attributes (like name, age) and methods (like greet).
When you create an object from that class, it inherits all those attributes and behaviors.
✨ Why classes matter:
✔️ Help organize and reuse code efficiently
✔️ Enable Object-Oriented Programming (OOP)
✔️ Make complex programs easier to maintain
✔️ Allow encapsulation and abstraction for cleaner design
In short, classes = structure behavior → organized, reusable, and scalable Python code.
👉 This series is designed for Data Analysts, Data Scientists, Python Developers, and Automation Engineers — helping you write cleaner & more efficient Python code.
If this helped you understand something new, drop a ❤️ or 🔁
and stay tuned for more “Effective Python Coding” posts!
#Python #EffectivePython #CodingSeries #100DaysOfCode #OOP #Programming #ML #AI #DataScienceTools
1
6
314
6 Oct 2025
🔥 Day 20 — Effective Python Coding Series
Today’s focus: Partial Functions 🐍
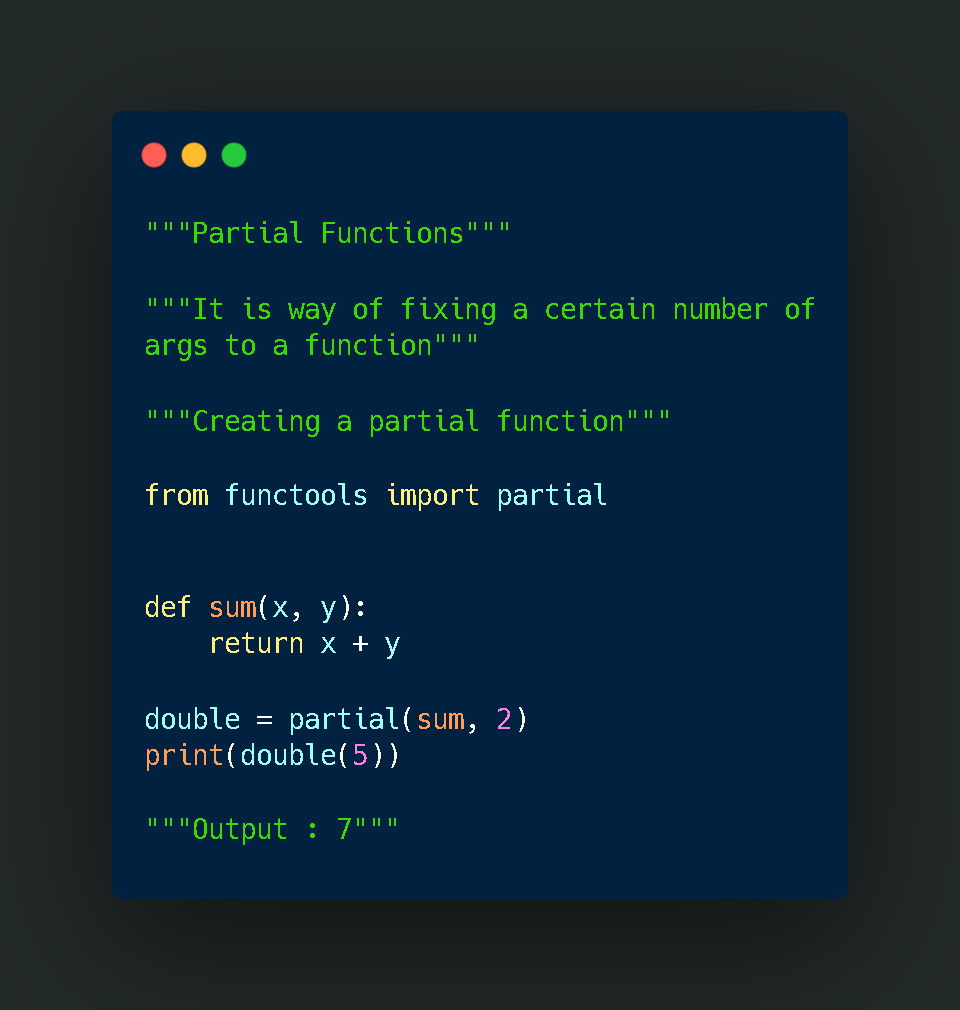
In Python, partial functions allow you to fix a certain number of arguments of a function and create a new one with fewer parameters.
They help you simplify your code by predefining some inputs while keeping the logic reusable and clean.
✨ How they work:
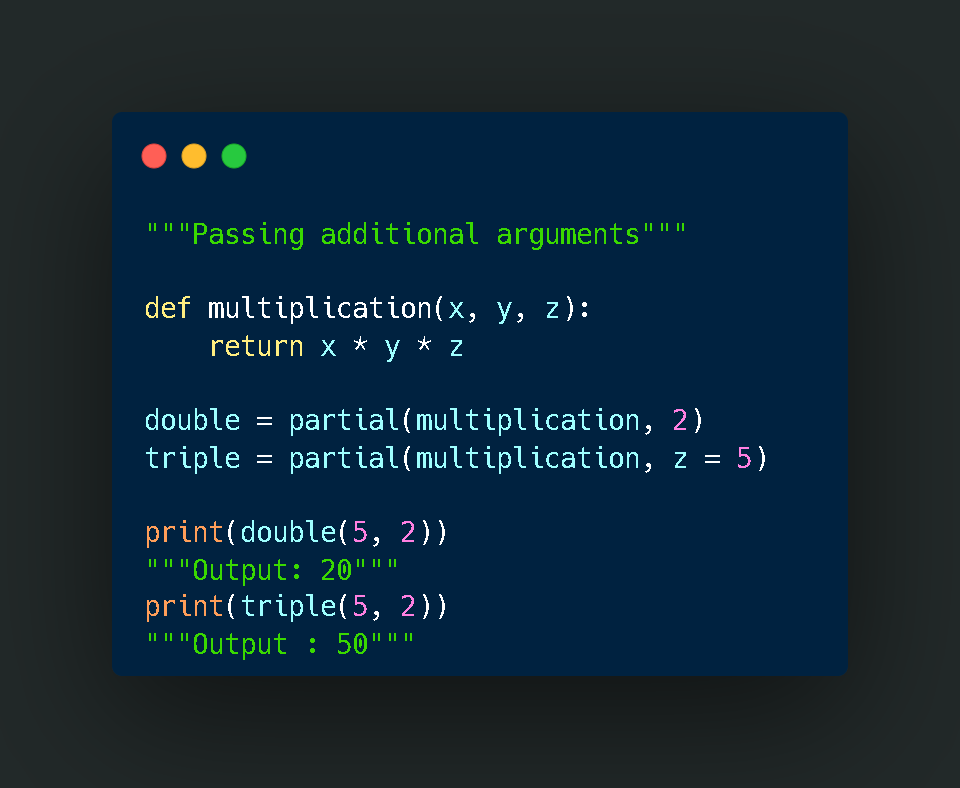
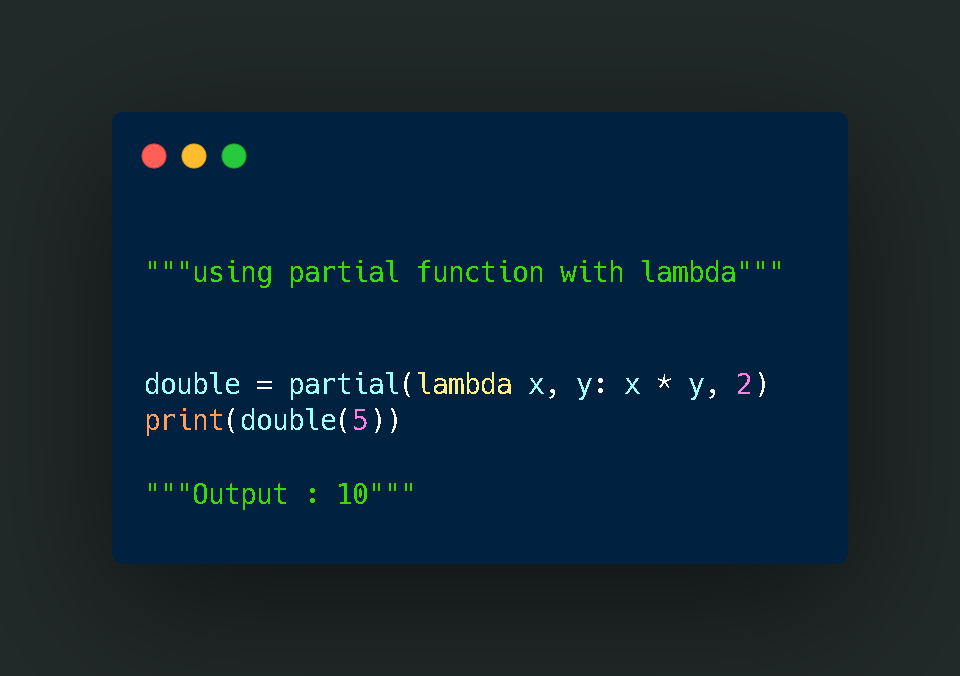
You take an existing function and “lock in” one or more arguments — the new function remembers these fixed values. When you call it later, you only provide the remaining arguments.
✨ Why partial functions matter:
✔️ Simplify repetitive function calls
✔️ Improve code readability and maintainability
✔️ Work seamlessly with higher-order functions
✔️ Perfect for scenarios where you reuse similar logic with minor changes
In short, partial functions = preset arguments → cleaner, reusable code.
👉 This series is designed for Data Analysts, Data Scientists, Python Developers, and Automation Engineers — helping you write cleaner & more efficient Python code.
If this helped you understand something new, drop a ❤️ or 🔁
and stay tuned for more “Effective Python Coding” posts!
#Python #EffectivePython #CodingSeries #100DaysOfCode #FunctionalProgramming #ML #AI #DataScienceTools
2
3
316

27 Sep 2025
If Julia runs too fast on GPU, should we call the data ambulance in Jupyter?"
Source: devhubby.com/thread/how-to-r…
#DataScienceTools #NVIDIA #DataScience #Learning #notebook #gpu
2
18
24 Sep 2025
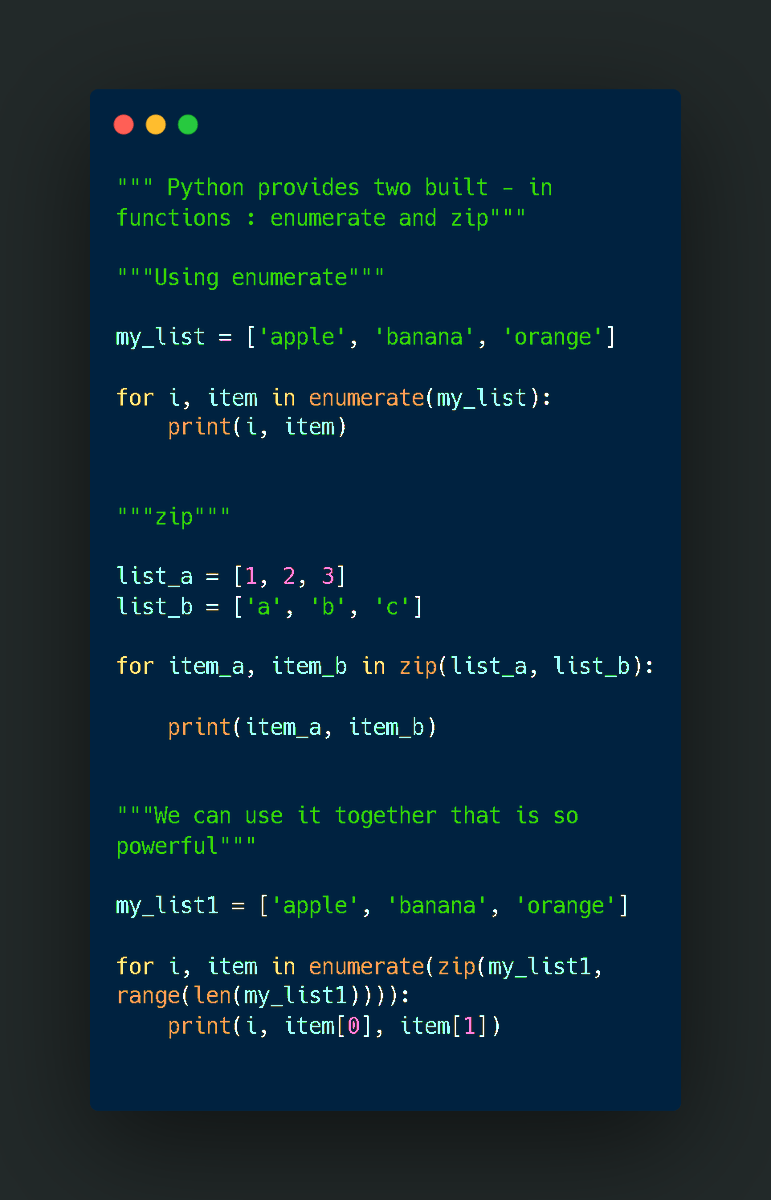
🐍 Day 9 – Effective Python Coding
Today’s gems: zip() & enumerate() 💎
🔹 enumerate() → adds index while looping
🔹 zip() → pairs multiple lists
🔹 Together → super clean, Pythonic code ✨
🐍 If you use or love Python — devs, ML/AI folks, data science, or analytics — this series is for you.
👉 Follow for daily Effective Python Coding tips!
Code in image 👇
#Python #Coding #DataScienceTools #AI
1
6
374
20 Sep 2025
🚀 Gradient Boosting: turning weak learners into a powerhouse!
Each new tree learns from the errors of the last—like teamwork in action. 🌱🌳➡️🌲
That’s why it powers XGBoost, LightGBM & CatBoost, the backbone of many Kaggle wins 🏆
#MachineLearning #AI #DataScienceTools
4
241

28 Jun 2025
🔍 Top Python Libraries for Data Analysis in Data Science & Finance 🐍📊
When it comes to Data Science, Python is the go-to language, and it’s packed with powerful libraries to handle every stage of data analysis. Here are some of the most popular libraries that make Python a must-have tool for data scientists and financial analysts alike!
1. NumPy 💡
What it does: Essential for numerical computing. NumPy provides support for large, multi-dimensional arrays and matrices, along with mathematical functions to operate on these arrays.
Why it matters: Speed and efficiency for handling large datasets and performing complex calculations.
2. Pandas 🐼
What it does: A high-performance, easy-to-use data structure for manipulating and analyzing structured data. It's perfect for data wrangling, cleaning, and transforming data.
Why it matters: Ideal for financial data analysis, working with time-series, handling missing values, and merging datasets.
3. Matplotlib 📈
What it does: The fundamental library for data visualization. Create static, animated, and interactive plots.
Why it matters: Essential for building line charts, scatter plots, and bar charts for visual analysis.
4. Seaborn 🌈
What it does: Built on top of Matplotlib, it simplifies statistical plotting with advanced capabilities like heatmaps, violin plots, and pair plots.
Why it matters: Makes creating beautiful, informative visualizations easy, especially for exploratory data analysis.
5. SciPy 🔬
What it does: Used for scientific and technical computing, SciPy builds on NumPy by providing a large collection of algorithms for optimization, linear algebra, and statistics.
Why it matters: Useful in financial modeling and scientific research for more complex mathematical operations.
6. Statsmodels 📊
What it does: Provides classes and functions for estimating many statistical models, including regression analysis, time series analysis, and statistical tests.
Why it matters: A go-to for statistical modeling and hypothesis testing, commonly used in finance to analyze market trends and portfolio optimization.
7. Scikit-learn 🧠
What it does: A machine learning library that provides simple and efficient tools for predictive data analysis.
Why it matters: Ideal for implementing classification, regression, clustering, and dimensionality reduction techniques. Widely used in financial analysis for predictive modeling.
8. TensorFlow & Keras 🤖
What it does: Deep learning frameworks that allow the development of neural networks, including LSTM, for time-series prediction.
Why it matters: Crucial for building advanced machine learning models in areas like quantitative finance, AI, and stock price prediction.
9. PyTorch 🔥
What it does: Another deep learning framework, often preferred for research due to its dynamic computation graphs and ease of debugging.
Why it matters: Great for advanced AI models in finance, especially for forecasting, reinforcement learning, and market prediction.
10. QuantLib 📉
What it does: A library for quantitative finance, QuantLib is used for modeling, trading, and risk management in financial markets.
Why it matters: Provides tools for option pricing, fixed income calculations, and risk analytics – essential for anyone working in financial engineering.
11. TA-Lib 📈
What it does: A technical analysis library that provides over 150 indicators for stock market analysis.
Why it matters: Crucial for technical traders looking to identify trends, moving averages, RSI, MACD, etc.
12. Plotly 📊
What it does: Interactive plotting library, enabling dynamic visualizations that can be embedded into web applications.
Why it matters: Highly used in dashboarding and creating interactive charts for better financial data analysis presentations.
13. Bokeh 🌐
What it does: A powerful library for creating interactive visualizations that can be deployed in web browsers.
Why it matters: Perfect for building web-based visual analytics tools to present financial data interactively.
💡 Which ones do you use in your data science and finance workflows? Let’s discuss the power of these tools and how they can help improve your analysis!
#DataScience #MachineLearning #AI #DataAnalysis #Python #BigData #DataVisualization #NumPy #Pandas #TensorFlow #ScikitLearn #Finance #FinTech #QuantitativeFinance #StockMarket #QuantLib #AIinFinance #DeepLearning #TimeSeries #Analytics #DataScienceTools

2
39

14 Apr 2025
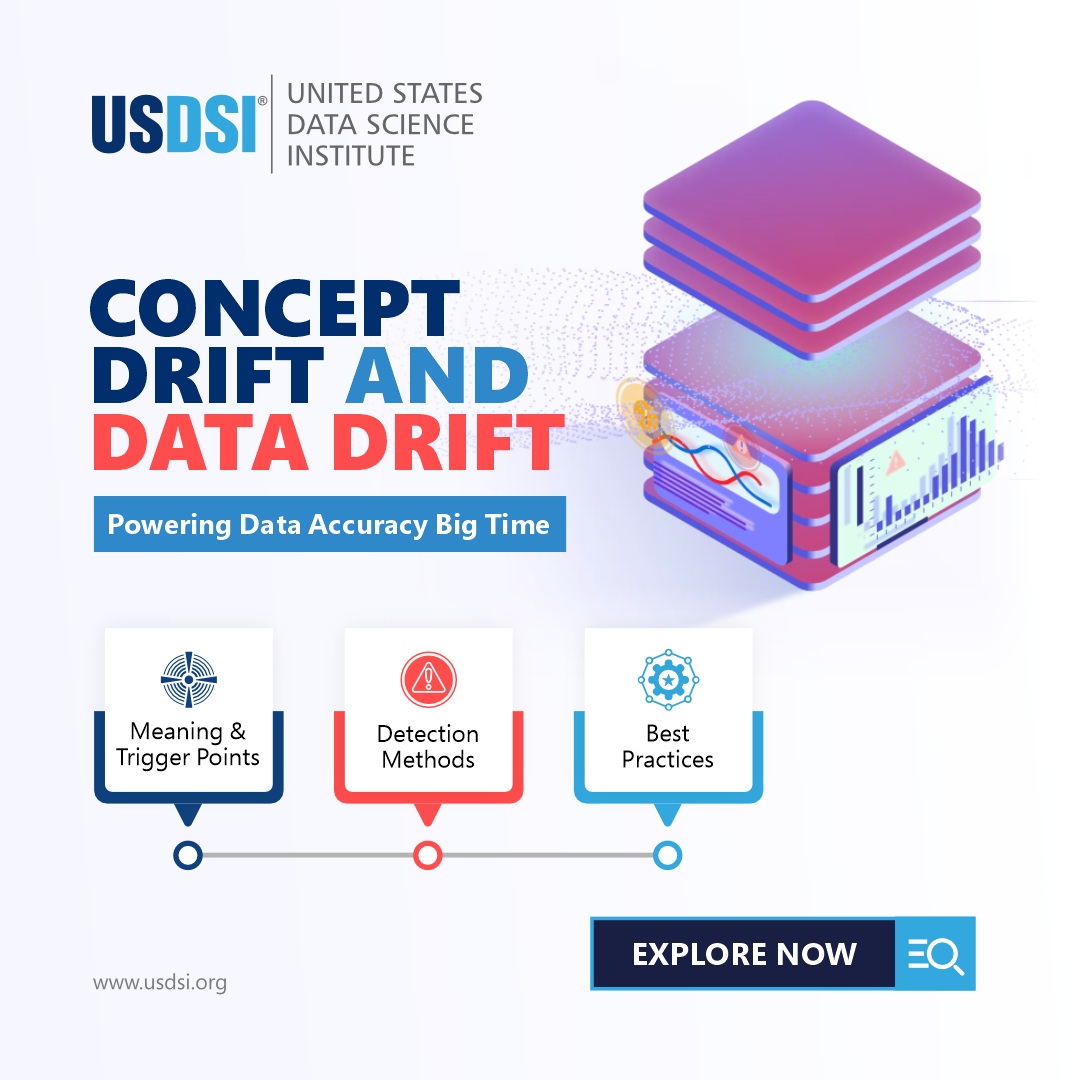
Machine learning models can deviate from reaching their target results due to the evolving diversities in the data collected.
Explore the read now bit.ly/3RA0nlj
#MachineLearningModels #MLModels #LargelanguageModels #DataScienceIndustry #DataScience #DataScienceTools
1
2
16

14 Jan 2025
#181 Optimizing Retrieval-Augmented Generation (RAG) Pipelines with AutoRAG
#AutoRAG #MachineLearning #RetrievalAugmentedGeneration #AIOptimization #DataScienceTools #DataScienceDemystifiedDailyDose
linkedin.com/pulse/181-optim…
4
5
41
1 Dec 2024
#138 Tablib: A Lightweight Solution for Managing Tabular Data in Python
#PythonLibrary #DataManipulation #Tablib #DataScienceTools #PythonProgramming #AI #Python #MachineLearning #DataScienceDemystifiedDailyDose
linkedin.com/pulse/138-tabli…
7
7
44

18 Nov 2024
You must understand which tool is good for which task as a data analyst.
This will allow you to deliver projects on time, ensuring optimal quality. Switching between tools according to tasks becomes easier once you get enough experience with each tool.
𝗟𝗲𝘁 𝗺𝗲 𝗴𝗶𝘃𝗲 𝘆𝗼𝘂 𝗮𝗻 𝗲𝘅𝗮𝗺𝗽𝗹𝗲:
• You have a large dataset to clean, preprocess, and transform. SQL is the best choice here.
• You may want to summarize data, you can do that in SQL using the "Pivot" command (in some RDBMS like Oracle, or SQL Server). If you don't know how to do that, you can summarize it in Excel very easily using pivot tables.
• If you want to perform EDA, I will again recommend SQL because it is great for that.
• Now, if you want to visualize data, you may use Power BI, Excel, Tableau, or Python according to the needs of the client or company you are working for.
• If you want to create automated data analysis scripts with visuals, then Python is the best choice.
Again, I am not saying that you cannot perform certain tasks with certain tools. I am just saying that these are the tools that I feel are optimal according to tasks.
Also, in my experience as a data analyst working with worldwide start-ups and clients, especially from the US, and UK, this is how I use these tools for data analytics tasks.
Enjoy. Follow for more!
#DataAnalytics #DataAnalyst #DataTools #AnalyticsBestPractices #SQLForData #PythonForData #PowerBI #ExcelTips #DataVisualization #EDA #PivotTables #AnalyticsSkills #DataInsights #USDataAnalyst #UKDataAnalyst #EuropeDataAnalyst #GlobalDataCareers #AnalyticsCommunity #HiringDataAnalysts #DataJobs #AnalyticsEfficiency #DataScienceTools #BusinessAnalysis #DataCareers #DataStrategy

2
30

16 Nov 2024
For Basic Text Processing Tasks like Tokenization and Stemming in NLP, which tool do you use?
Cast your vote and share your thoughts below!
📌 Follow @1stepGrow Academy for more updates on NLP.
#1stepGrow #TextProcessing #Tokenization #Stemming #DataScienceTools #DataScience
0%
NLTK
0%
TEXTBLOB
0%
SPACY
0%
STANFORDNLP
0 votes • Final results
3
25

8 Nov 2024
The next set of recordings from Dyalog '24 is now available. Read Morten's blog post, and watch (or rewatch!) presentations on the APL Forge, Education, and Data Science, at dyalog.com/blog/2024/11/dyal…
#Dyalog24 #Dyalog #APL #DataScienceTools #DataScience #Education
ALT Dyalog '24 Videos, week three: The APL Forge, Education, and Data Science
2
9
205


4 Nov 2024
2️⃣ Python for Data Science: Python is a powerhouse for data work. This course dives into the basics of Python, teaching variables, data types, and the libraries that make data analysis easier, like Pandas & NumPy. #Python #DataScienceTools
1
1
649
2 Nov 2024
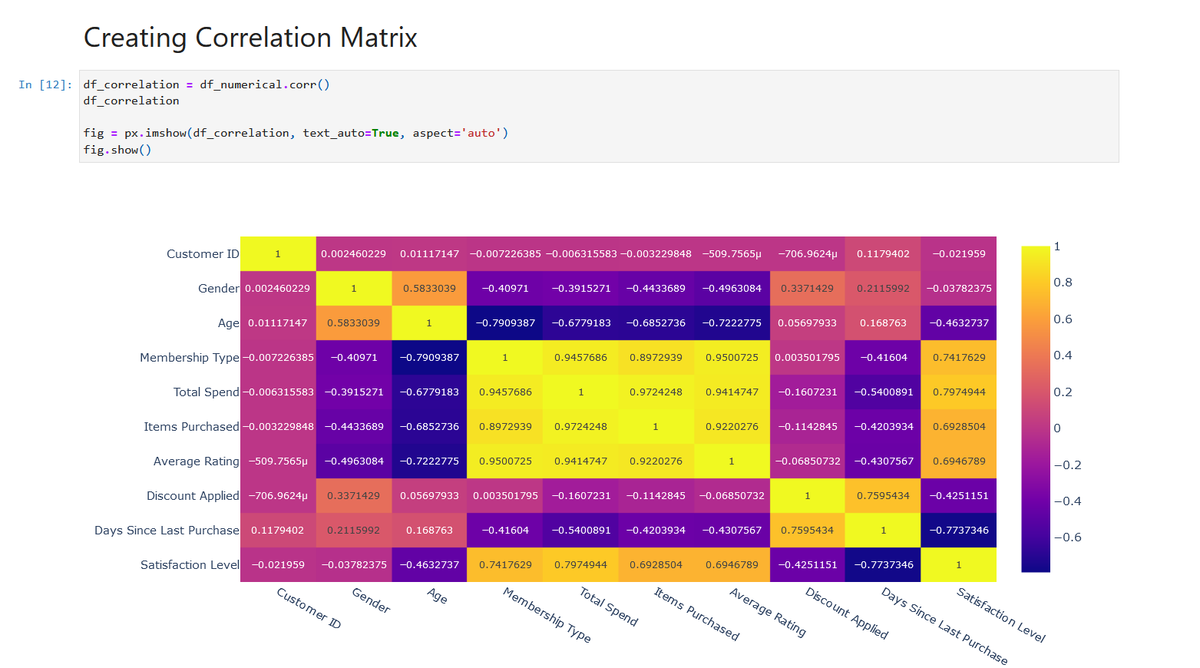
When you are working as a data analyst using Python, you have a lot of tools with which you can understand your data more.
To understand the relationship between your variables, you can create a correlation matrix in a second.
Let's discuss that in this thread.
#DataAnalysis #PythonForData #CorrelationMatrix #DataVisualization #AnalyticsInsights #DataScienceTools #DataAnalytics #DataAnalystLife #TechTips #DataTechniques #DataCommunity #DataScienceUSA #AnalyticsUSA #USDataCareers #DataAnalystUSA #UKDataScience #AnalyticsUK #DataAnalystUK #UKTechCareers #EuropeData #DataAnalystEU #EUDataCareers #AnalyticsEurope #GlobalData #AnalyticsWorldwide #DataScienceGlobal #InternationalDataCommunity
1
2
22

24 Sep 2024
2. Save Time, Boost Productivity
Working with stock prices or large datasets? cuDF transforms hours into minutes. More speed means more insights. 💡 #DataScienceTools #BigData
2
8
736

4 Sep 2024
🌟 Meet Dr. Denis Yarats (@denisyarats ) at GENAI Summit Silicon Valley 2024! 🌟
We are excited to welcome Dr. Denis Yarats, CTO & Co-Founder of @perplexity_ai , to the GENAI Summit 2024! 🎤
In a previous interview with Wired, @nvidia CEO Jensen Huang(@nvidia_ceo ) revealed that he uses Perplexity almost every day. Perplexity is not just a next-generation search engine—it's an ”AI-powered professor“ that breaks down complex queries and delivers comprehensive, data-backed insights. Denis Yarats and his team are pushing the boundaries of what AI-driven search can achieve.
Join us at the Santa Clara Convention Center from November 1st to 3rd to hear from Dr. Yarats on how Perplexity is revolutionizing the way we interact with information and AI. 🚀
📅 Event Date: November 1-3
📍 Location: Santa Clara Convention Center, Silicon Valley
🔗 Get Your Tickets: genaisummit.ai
Don’t miss this chance to learn from one of the brightest minds in AI and search technology! 🌐
#AIForAll #AIInnovation #NextGenSearch #TechSummit #AIProfessor #AIUnicorn #GenerativeAI #TechLeaders #PerplexityAI #DataScienceTools

1
2
246

🚨 Few hours hurry up now! 🚨
Don’t miss out on our upcoming webinar: Unlock the Power of Graph Analytics with ArangoDB’s Data Science Suite!
Register now - okt.to/3e7Hkr
#DataScience #GraphAnalytics #ArangoDB #GraphML #GenAI #TechWebinar #GraphRAG #DataScienceTools

1
2
157

27 Aug 2024
🚨 Last Chance to Sign Up! 🚨
Don’t miss out on our upcoming webinar: Unlock the Power of Graph Analytics with ArangoDB’s Data Science Suite!
Register now - okt.to/NEdk3U
#DataScience #GraphAnalytics #ArangoDB #GraphML #GenAI #TechWebinar #GraphRAG #DataScienceTools

1
2
59
🚨 Last Chance to Sign Up! 🚨
Don’t miss out on our upcoming webinar: Unlock the Power of Graph Analytics with ArangoDB’s Data Science Suite!
Register now - okt.to/uRiYTX
#DataScience #GraphAnalytics #ArangoDB #GraphML #GenAI #TechWebinar #GraphRAG #DataScienceTools
2
155