
深海魚X🫥 retweeted

Jun 7
gnuplot>set logscale
Jun 2

【中高生に人気 アプリSetlogとは】
news.yahoo.co.jp/pickup/6582…
1
10
2,015


May 29
The team at @asymptotelabs is moving at lightning speed to meet enterprises where they are.
This week, Agent Beacon added:
→ @Microsoft Sentinel forwarding a ready-to-use Sentinel content pack
→ VS Code @github copilot Chat telemetry with low-noise event normalization
→ @antigravity CLI hook support for prompts, tools, commands, file edits, and diffs
→ New forwarding paths for @CrowdStrike Falcon LogScale, @rapid7 InsightIDR, and @SumoLogic
→ @github Copilot CLI support across prompts, sessions, tools, and approvals
→ A local MCP server to search and summarize Beacon activity from runtime.jsonl
→ Reliability upgrades: bounded log rotation, safer concurrent writes, stronger diagnostics, and cleaner SIEM packs
We love hearing feedback from the industry. Try out Agent Beacon and let us know what you think!
Github Link below in the comments 👇.
3
1
3
209

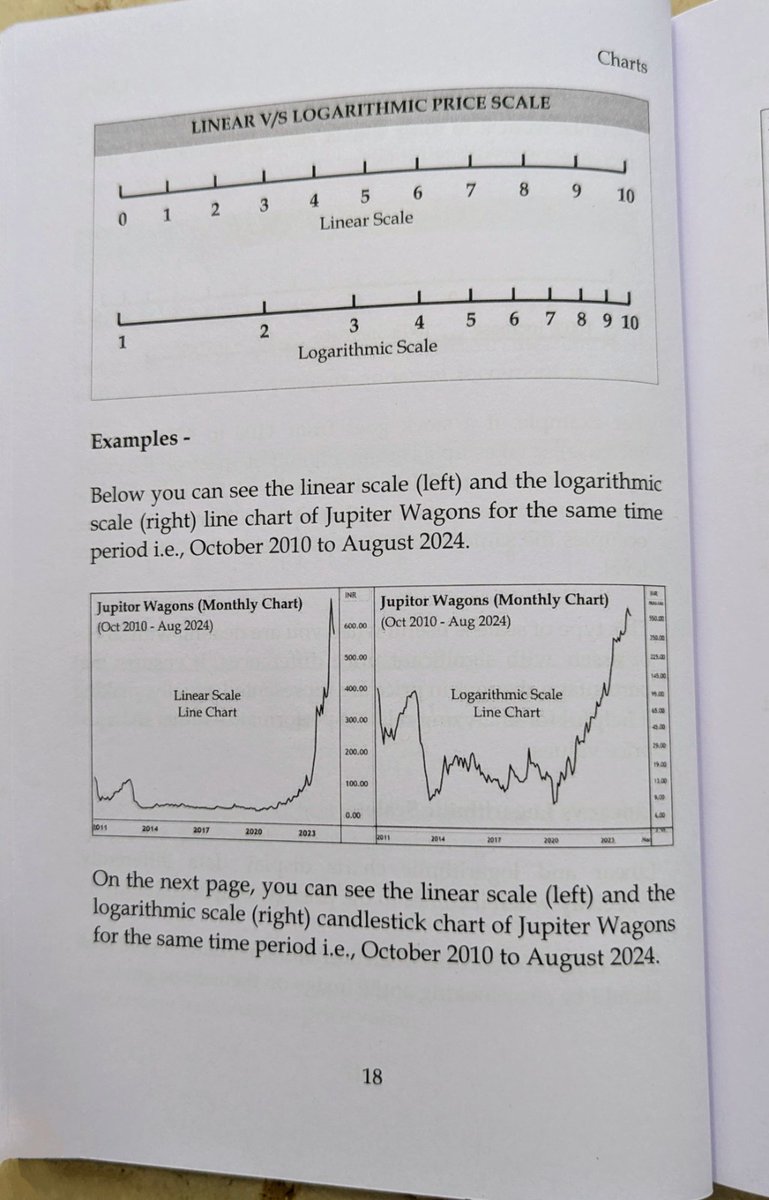
📊 Linear vs Logarithmic Scale
Same stock, same time frame, but a totally different view of price action.🔍
Log scale helps visualize % moves better📈
Source: Trading Candlestick Patterns 📘by @Mr_Chartist
#StockCharts #TradingTips #LogScale #LinearScale #TechnicalAnalysis

1
7
495


May 27
Tyhle ty grafy... 👀, ty logaritmický grafy 😉👇🤝#LogScale
May 27

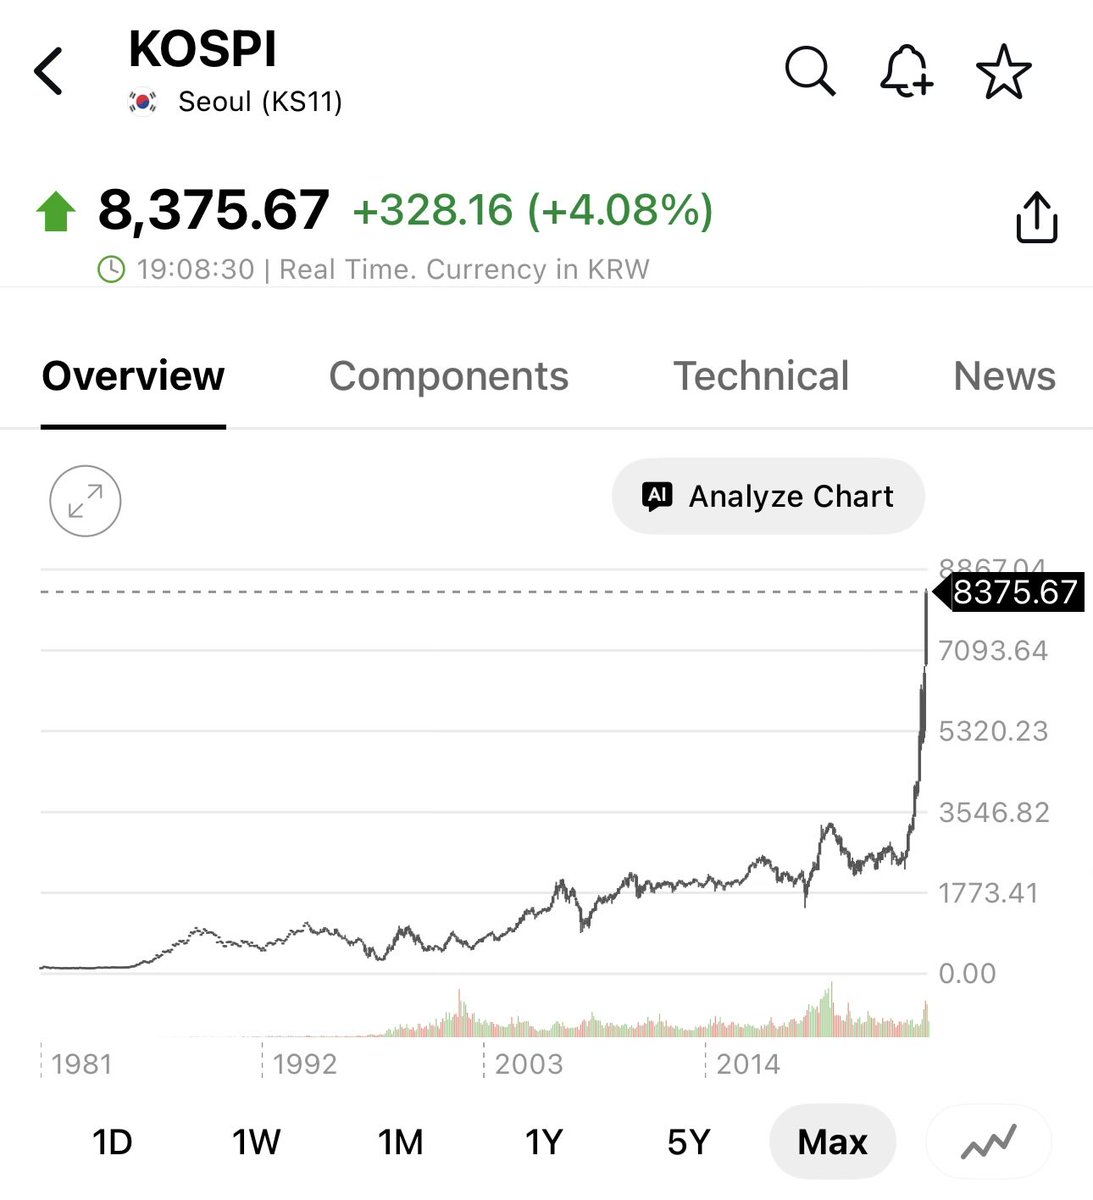
The Korean stock market is up another 4% tonight.
This is truly unbelievable what we are witnessing.
Everything memory related has gone straight vertical.
3
20
5,605

May 25
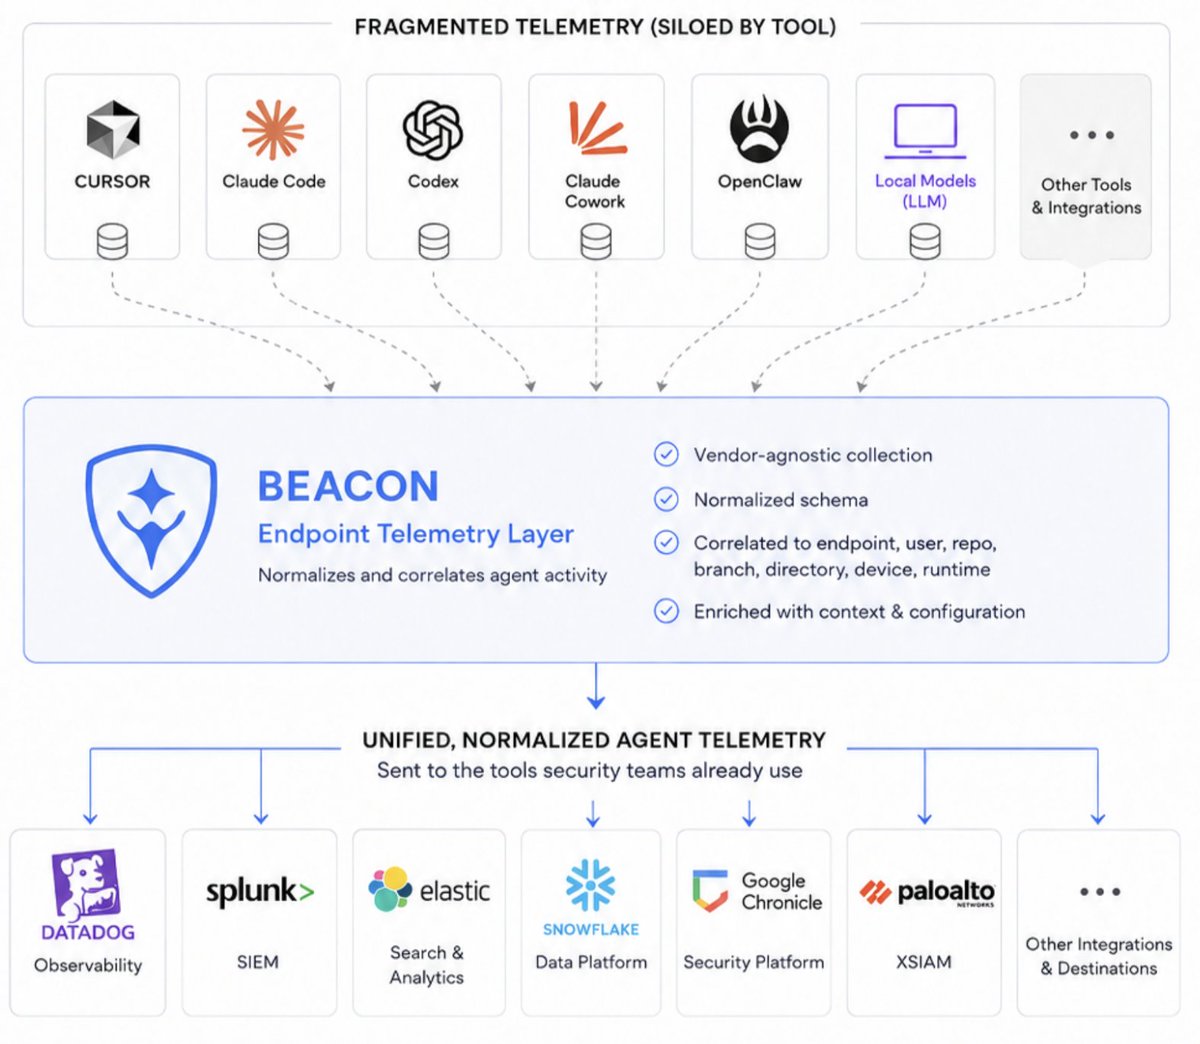
Announcing the latest release of Agent Beacon by @asymptotelabs:
→ @CrowdStrike Falcon LogScale HEC forwarding, including configurable Falcon endpoint flags
→ Vector (OSS observability pipeline by @datadoghq) forwarding templates for @SumoLogic and @rapid7
This release makes it easier for enterprise teams to forward local AI agent activity into the platforms they already use, while preserving a local-first audit trail on the endpoint.
Agent Beacon is designed to meet teams where they already work: local auditability by default, customer-managed forwarding when needed, and clean integrations with the SIEM and log platforms already in place.
We have an extremely ambitious roadmap and will continue shipping rapidly based on feedback from enterprise security and IT leaders adopting Beacon’s solution to the agent visibility problem.
Github Link and Docs in the comments below 👇!
4
2
8
294

May 24
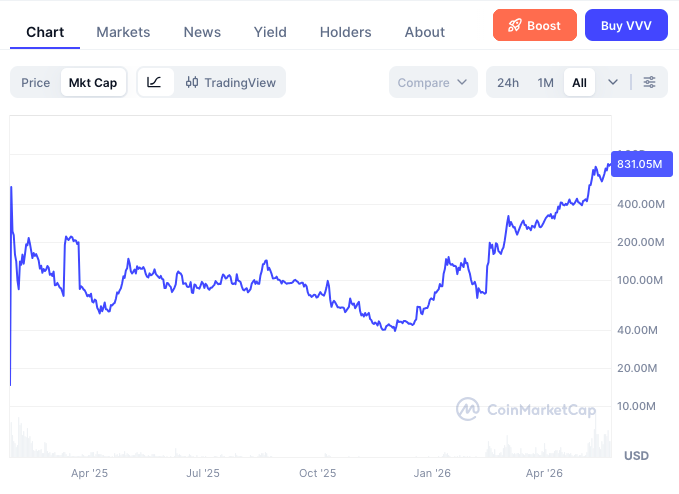
If you look at $VVV chart in logscale, then you see Venice didn't even go parabolic yet, just slow and steady move up
3
4
38
1,344

May 11
Put it LOGSCALE
Its not different this time.
Its just debt-based money supply increasing exponentially to prevent a debt-default spiral.
7
2,555

May 11
What if your trend lines could explain themselves?
I just updated ST-EP06 — Isotropic Trend Lines — with a new approach: visual transparency.
Instead of just drawing channels, the indicator now lets you see the reasoning behind them:
Toggle Show Blocks to see the structural units it builds from price
Toggle Show Angle Line to see the exact slope that produces the ICS angle
Watch how geometric means connect across blocks to reveal direction
Channel lines now stop cleanly at convergence — no visual artifacts
The idea: you shouldn't have to trust an indicator blindly. You should be able to follow its logic, step by step, right on the chart.
4 new features. Same core engine. Zero cost.
Open source. Free. Editor's Pick.
Try the trend lines yourself
tradingview.com/script/ZSgx4…
#TradingView #PineScript #TrendLines #TechnicalAnalysis #OpenSource #FreeIndicator #EditorsPick #TrendChannel #SmartTrader #ICS #IsotropicTrendLines #YangZhang #Volatility #ChannelFitting #MultiScale #TradingTools #ChartAnalysis #PriceAction #StructuralAnalysis #LogScale #TrendDetection #BreakoutTrading #RetestStrategy #SigmaNormalized #BlockAnalysis #GeometricMean #ScaleInvariant #AlgoTrading #QuantTrading #TradingEducation
2
288

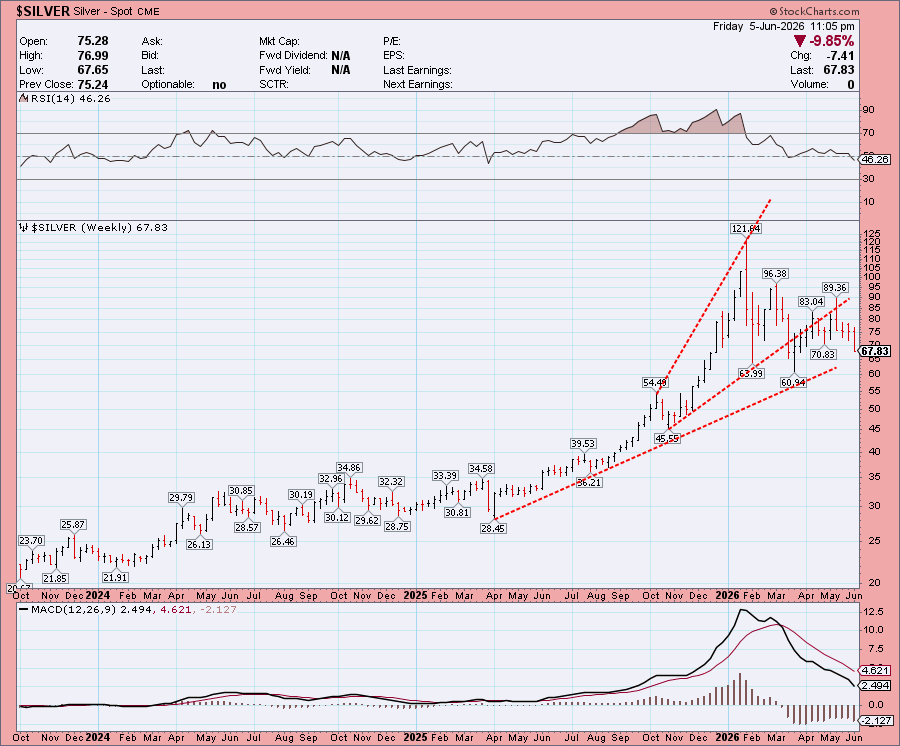
May 10
Last week you posted a silver chart in weekly logscale whereby you commented that until the trend line is broken be weary. We broke out last last week. Aren't you bullish now based on last week's stance since we broke out?
2
3
433

May 7
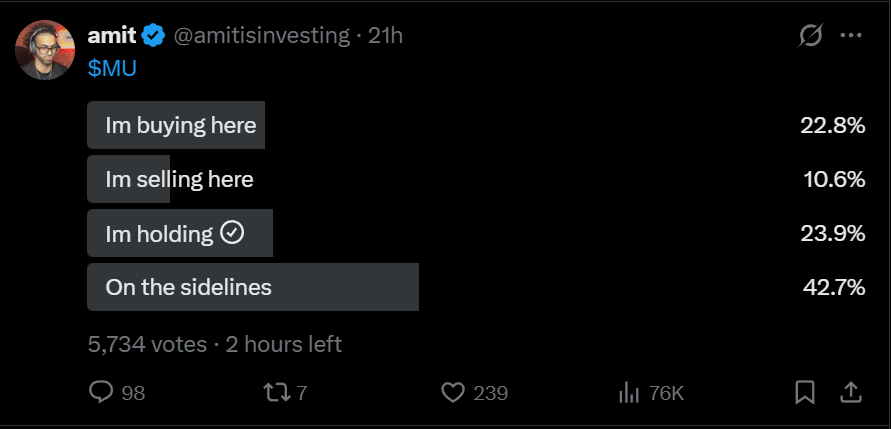
$MU $SNDK (longs)
Attached is a valuable study from @Braczyy on prior big cap parabolic reversals.
Just talking about $MU and $SNDK which I have a position (missed out on $INTC). My observation is that money seems to be still pouring into these names this week and the intraday dip today is bought, and most retails are actually still missing out (>40% from Amit's poll) from $MU long trades.
The moves may "feel" extended. Objectively it can also be "technically" extended (but can be much more extended as can be seen from the study). But market doesn't care about your feelings or the extension, market cares about "structure" (this is a reminder for those who not only missed out on the long side but also want to rush to short a parabolic move).
Moreover they have the fundamentals and rerating thesis to support higher valuation (alright, you don't look at fundamentals, that's for longer term anyway). Every MI350 chip sold by $AMD locked in a high margin HBM4 for $MU, and their data centers growth from the recent earnings is 40%.
Personally I treasure my existing holdings with profit cushion. I don't know when the PB or digestion would be, but I plan to sit on the majority and ride the trend for the longer term. Might sell some partials too, but even that needs a process. say by WON's LogScale UTL or when there is certain structure (visually a swing high follow through) shown on the chart.


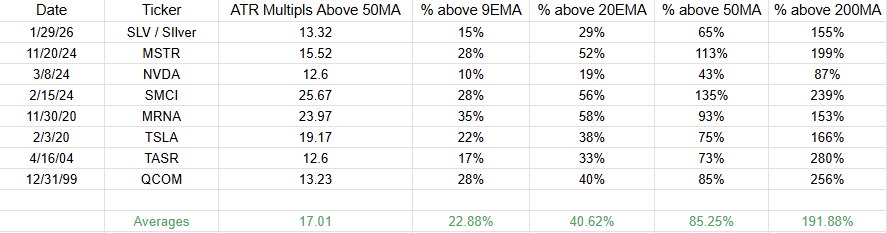
Many people been reached out asking about parabolics on $SNDK $MU $INTC etc.
Here is a small database I did a while back studying some prior big cap parabolic reversals. Studied their ATR multiples from 50MA the day before the peak as well as the % extension above specific moving averages
ATR multiples above the 50MA from @jfsrev beat simple percent gains because they adjust for the stock's unique volatility. That is what I like to focus on the most. Helps reveal true overextensions in parabolic moves that just straight up percentages often mislead imo.
The average ATR multiple above 50MA on these listed is 17x and that is BEFORE the climax day, some have hit highs of 25-30x the day they peak.
$SNDK is only sitting at 11.35x as of the close, notably below the average. It also is below average for all of the % above MA readings besides 200ma.
These names can get much more extreme than you think. You need strict criteria for these setups or it's a waste of time.
1
5
33
14,127

May 4
👉Toronto Police Bust Canada's First SMS Blaster Cybercrime Operation
👉CrowdStrike Patches Critical LogScale Vulnerability Allowing Unauthenticated File Access
👉Vercel Breach Traced to Roblox-Seeking "Patient Zero" at Context ai ... and more in axisofeasy.com/aoe/axisofeas…
1
2
165
📊 Linear vs Logarithmic Scale
Same stock, same time frame, but a totally different view of price action.🔍
Log scale helps visualize % moves better📈
Source: Trading Candlestick Patterns 📘by @Mr_Chartist
#StockCharts #TradingTips #LogScale #LinearScale #TechnicalAnalysis
1
4
6
2,033

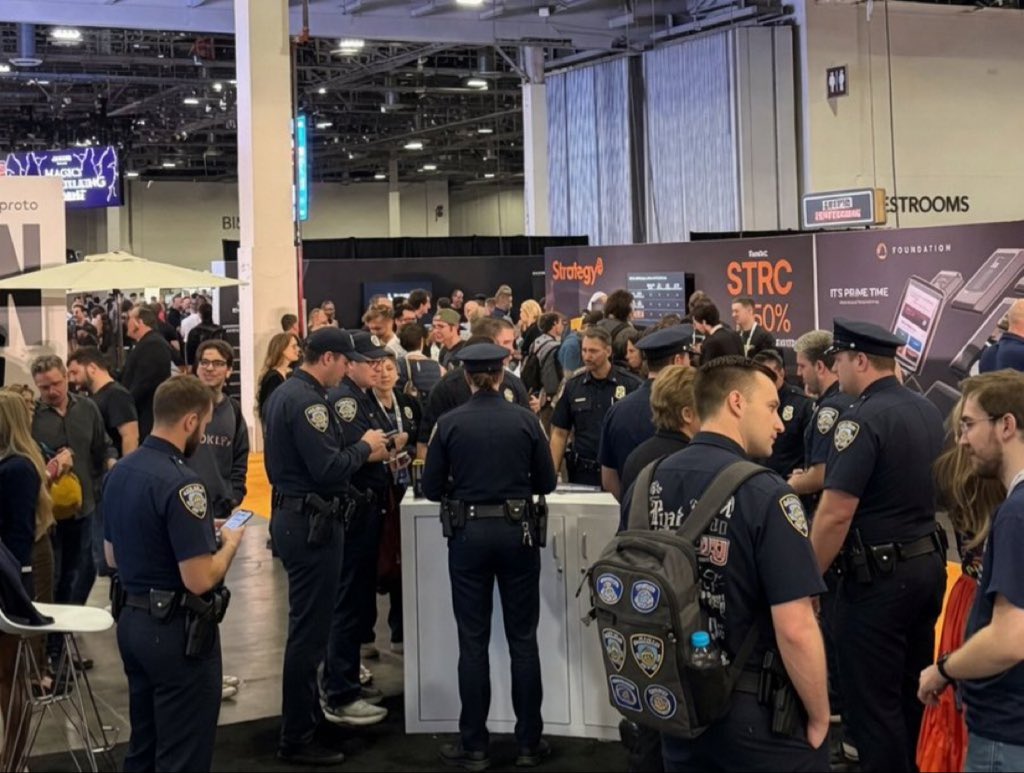
They found logscale

2
175

Apr 27
Critical flaw in CrowdStrike LogScale (CVE-2026-40050) lets attackers read files without login on self-hosted setups.
Read the full analysis: zyberwalls.com/2026/04/crowd…
#CyberSecurity #ZeroDay #CrowdStrike #ThreatIntel #InfoSec
1
2
173
Apr 27
Classical trendline: two pivots, a ruler, and personal intuition.
Here's the problem — the same line draws a different angle on BTC, on gold, on EURUSD. Price scale and volatility differ across instruments. Trend angle is not comparable.
The Isotropic Coordinate System (ICS) solves it:
y = ln(p) / σ
Log-price normalized by Yang-Zhang volatility. The result: a dimensionless space. A 45° angle — in any market — means "price is moving at 1σ per candle".
What this engine actually does:
▸ Splits history into blocks; reduces each block to a log-midpoint geometric mean — a central tendency without close-price bias
▸ Finds the longest monotonic segment → direction
▸ Computes the ICS angle from the σ-normalized slope
▸ Builds a log-linear channel from 4 extremes (HH · LH · HL · LL)
▸ Runs 6 scales in parallel (3 · 7 · 13 · 19 · 29 · 47) — agreement = structural trend
▸ Generates signals via a 5-state breakout/retest machine with a dynamic 1σ threshold
Structure > Price. Log > Linear. Proof > Hunch.
ST-EP06 — Episode 6 of the Smart Trader series.
#TradingView #Pinescript #technicalanalysis #chartanalysis #trendanalysis #trendlines #algotrading #quanttrading #volatility #YangZhang #logscale #priceaction #supportresistance #channelanalysis #breakout #retest #stockmarket #stocks #investing #daytrading #crypto #bitcoin #forex #trader #traders #financialmarkets #marketanalysis #SmartTrader #STEP06 #USA
1
5
374

Apr 27
Even the defenders need defending.
CrowdStrike & Tenable: two major cybersecurity firms just patched serious bugs in their own tools-
*CrowdStrike's LogScale: attackers could read any server file remotely, no password needed
*Tenable's Nessus: attackers could delete files & run malicious code with system privileges
The good news? Both found the bugs internally. No exploitation in the wild. Patches are out.
If your team uses these tools go update.
Now.
#CrowdStrike #Tenable #Cybersecurity #InfoSec
2
56