
AgentPerf just dropped as the first real benchmark for production agents — real code repo tasks, long tool chains, cost and efficiency under load. Not another IQ test. This is the signal the field needed: focus on systems that survive public execution, not demos. NVIDIA's Blackwell showing 20x agents-per-watt on these workloads reinforces it. Build for reliability and infrastructure from day one or get left behind when the agents scale.
#AgentWorkflows #ProductionAI #ExecutionMatters
1
4

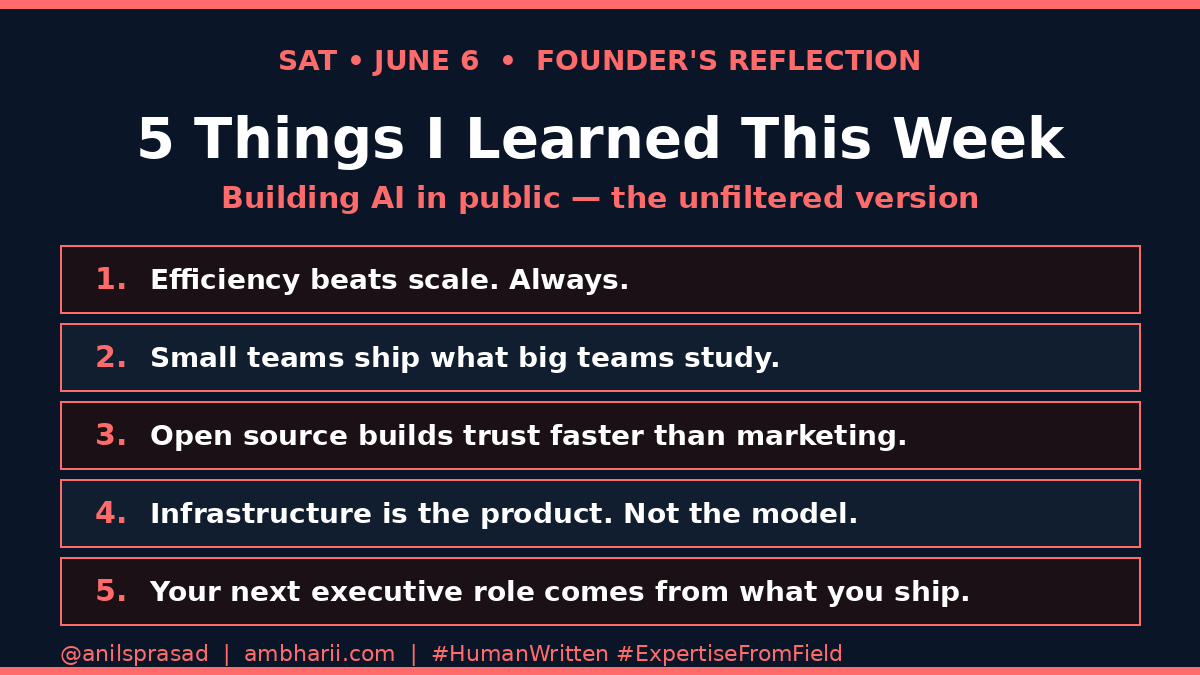
Five lessons. One week. All earned the hard way.
The one I keep coming back to:
Calibrated uncertainty is harder than accuracy.
Knowing what you do not know is the skill that separates production AI from demo AI.
#Founder #AI #ProductionAI #HumanWritten #ExpertiseFromField
1

16h
A useful AI prototype should not prove that AI is interesting. Everyone already knows AI is interesting.
The prototype should prove whether one defined business capability is feasible, useful, and worth expanding. That means the scope has to be bounded. Do not prototype “an HR assistant.” Prototype policy question answering from approved handbook sections, with source references and escalation guidance. Do not prototype “a finance chatbot.” Prototype invoice discrepancy review using invoice data, purchase orders, vendor terms, and business rules.
A good prototype should test the real shape of the work: inputs, outputs, documents, permissions, human review, workflow usefulness, logging, and failure detection.
For Microsoft-based organizations, the prototype should also test the implementation path: dot net, Azure OpenAI, SQL Server, SharePoint, Microsoft 365, internal A P Is, ASP.NET Core, OpenAPI, logging, review, and feedback.
The production workflow behind this video was built using the same methodology I apply for enterprise clients — I identified a real production bottleneck, evaluated AI options, and built a .NET-integrated workflow using AI tools to deliver it faster, better, and at lower cost. The thinking that improved my own workflow is the same thinking I bring to yours.
Explore more practical, applied enterprise AI insights at AInDotNet.com.
#EnterpriseAI
#AIPrototype
#AIImplementation
#AIAssistants
#MicrosoftAI
#DotNet
#AzureOpenAI
#BusinessAutomation
#WorkflowAutomation
#AIGovernance
#AIArchitecture
#SQLServer
#SharePoint
#Microsoft365
#APIs
#OpenAPI
#SemanticKernel
#ProductionAI
#AInDotNet
2
1
2
31

Jun 13
📡 LLM Observability, Tracing & Production Debugging — the nervous system that turns complex, opaque LLM systems into transparent, debuggable, and continuously improving production assets.
Just read this excellent technical white paper from @aasaitech on end-to-end request lifecycle tracing, key dashboards, failure mode detection, and closing the feedback loop.
Key highlights: • Full lifecycle trace: User Request → Prompt → LLM Call → Tool Use → Response → Feedback • Essential dashboards: Performance, Cost, Quality, Drift/Anomaly • Critical metrics: Latency (TTFT/P95), token usage, error rates, user satisfaction, MTTR • Tools: LangSmith, Phoenix (Arize), Helicone, OpenTelemetry, Grafana • Industrial impact: Faster root-cause analysis, cost control, reliability in maintenance copilots, safety systems, and edge orchestration
This caps the entire series perfectly — making all prior techniques (RAG, agents, hybrid AI, edge deployment, etc.) observable, trustworthy, and production-ready.
Full white paper infographic: x.com/aasaitech/status/20656…
How are you handling observability in your LLM deployments — LangSmith/Phoenix for tracing, Helicone for cost/latency, or full OpenTelemetry custom dashboards?
#LLMObservability #LLMOps #LangSmith #ProductionAI #IndustrialAI #AgenticAI #EdgeAI

19
Jun 13
⚙️ LLM Ops — the production infrastructure layer that turns powerful models into reliable, scalable, and cost-effective services at industrial scale.
Just read this excellent technical white paper from @aasaitech on serving engines (vLLM, TensorRT-LLM, TGI), caching, batching, streaming, observability, guardrails, cost tracking, fallback patterns, and governance.
Key highlights: • Full request lifecycle reference production architecture • Cost optimization: right model, aggressive caching, intelligent batching, dynamic routing • Observability stack: latency, tokens/sec, error rate, GPU health, user feedback, cost per token • Reliability patterns: fallback models, circuit breakers, graceful degradation, canary releases • Governance: guardrails, auditability, compliance, safety policies
This completes the full modern LLM production stack — from architecture and capabilities to evaluation and now the operational backbone needed for trustworthy deployment in manufacturing and edge environments.
Full white paper infographic: x.com/aasaitech/status/20656…
How are you handling LLM Ops in your deployments — self-hosted vLLM/TensorRT-LLM clusters, managed services, or full custom pipelines with observability guardrails?
#LLMOps #LLMServing #IndustrialAI #AgenticAI #ProductionAI #EdgeAI #vLLM
9
Jun 13
📊 LLM Evaluation — Benchmarks, LLM-as-Judge, and Production Metrics — the discipline that turns promising AI systems into consistently reliable, high-performing ones in the real world.
Just read this excellent technical white paper from @aasaitech on moving beyond generic academic benchmarks to a full multi-layered evaluation stack for industrial deployment.
Key highlights: • 5-layer stack: Test Data → Automated Eval (LLM-as-Judge rules) → Human Eval → Production Monitoring → Continuous Improvement • LLM-as-Judge workflow with calibrated rubrics human calibration • Production metrics that actually matter: Latency, cost, task success rate, hallucination rate, refusal rate, user satisfaction • Industrial use cases: Maintenance Q&A, report accuracy, agent task success, safety/compliance eval
Evaluation closes the loop on the entire series — from architecture and scaling to prompting, RAG, agents, multimodal, long context, hallucination mitigation, and now rigorous measurement for trustworthy production AI.
Full white paper infographic: x.com/aasaitech/status/20656…
How are you evaluating your LLM systems in production — generic benchmarks, LLM-as-Judge with rubrics, or full observability A/B testing pipelines?
#LLMEvaluation #LLMAsJudge #IndustrialAI #AgenticAI #ProductionAI #EdgeAI
18

Jun 12
A clean LLM architecture diagram can hide the hardest problems.
It can show an app, prompt, model, vector database, and response path. But it will not prove the system can handle weak retrieval, unsafe output, blind debugging, latency, cost, or bad fallback behavior.
Production AI architecture gets real when the request path runs, the trace is visible, and missing controls create consequences.
That is why LLM architecture has to be practiced, not just drawn.
#LLMArchitecture #ProductionAI #AISystems
llmarchitect.dev/blog/learn-…
1
1
18

3 agentic AI developments that actually matter for enterprises this week:
1. OpenAI is acquiring Ona, a secure runtime platform for AI agents. The real story isn't better code — it's giving agents a safe, contained environment to access tools and systems, which is the #1 barrier to production deployment right now.
2. Microsoft baked agent permission controls directly into the Windows kernel with MXC. When the OS enforces what an agent can and cannot access, governance stops being a prompt engineering problem and becomes a system-level guarantee.
3. OpenAI Oracle made enterprise AI procurement much easier. Companies can now use existing Oracle cloud credits to deploy models and Codex, removing a huge budget and procurement friction point for large organizations.
The entire industry is quietly shifting from "can agents do cool things?" to "can we deploy them safely and legally at scale?"
We build production-grade Agentic AI solutions designed for real enterprise governance. More in bio.
Which of these shifts will impact your team first?
#AgenticAI #EnterpriseAI #AIGovernance #ProductionAI

18

Jun 12
🚀 Only 6 days until RocketRide Cloud launches!!
Excited to announce @latitudesh as the official partner for the @RocketRideAI Launch Night 🎉
Join us on June 18 at @SHACK15sf for an evening with AI builders, enterprise teams, founders, and technical leaders shaping the future of production AI.
🔥 Live demos
🚀 RocketRide Cloud launch
🤝 Networking with the AI community
Join Discord to get more updates about the product and the event: lnkd.in/gKZhS8ZW
#RocketRideCloud #AIDE #ProductionAI

24
Jun 12
A generic AI assistant can summarize a support ticket, but that is not enough for production IT work.
IT teams need structured support: ticket category, affected system, severity, missing information, likely issue type, recommended next action, confidence, and escalation recommendation. That structure matters because real IT work happens inside queues, S L As, audit trails, user communication, defect tracking, and security review.
The practical starting point is not automatic action. It is decision support. Let the AI summarize, classify, recommend, and draft. Let the human review and decide. That approach builds trust, captures feedback, and helps the organization learn which parts of the workflow are stable enough for deeper automation.
This is where domain-specific AI assistant capabilities become more useful than generic chatbots. The model may be the same, but the surrounding workflow, rules, structure, and ownership create the business value.
The production workflow behind this video was built using the same methodology I apply for enterprise clients — I identified a real production bottleneck, evaluated AI options, and built a .NET-integrated workflow using AI tools to deliver it faster, better, and at lower cost. The thinking that improved my own workflow is the same thinking I bring to yours.
Explore more practical, applied enterprise AI insights at AInDotNet.com.
#EnterpriseAI
#ITSupport
#AIAssistants
#DomainSpecificAI
#MicrosoftAI
#DotNet
#AzureOpenAI
#AIArchitecture
#ProductionAI
#AIGovernance
#WorkflowAutomation
#BusinessAutomation
#HelpDesk
#IncidentManagement
#KnowledgeBase
#SLA
#ITOperations
#Microsoft365
#PowerPlatform
#AInDotNet
1
1
21

Anthropic just raised 3.5 billion dollars at a 61 billion dollar valuation. Big number, great headline. But there's a clause in the term sheet that matters more than the valuation. Anthropic is contractually required to keep 40% of their compute on AWS, and AWS gets preferred allocation rights on Claude API capacity when demand spikes.
So if you're running Claude pipelines and you're not on AWS, you are literally second in line during the moments when you need capacity the most. A product launch, an earnings cycle, a major news event. Those are exactly when your system gets deprioritized.
Now add this. The EU AI Act Tier-2 enforcement starts July 1. You have 18 days to get compliance documentation from every model provider you use. The fines are real. The enforcement calendar is real.
Two things to do this week. First, build a model routing fallback before you need one. Second, email your API providers today and ask for their EU compliance attestation. Don't wait.
The lesson here is not about Anthropic specifically. It's about any architecture built on a single dependency you haven't formally tested under failure conditions
Get the full briefing with hardware analysis, robotics deployment data, and research findings at 👇 miketowery.substack.com/
If you want a personalized intelligence brief, check out: briefingiq.ai/
#AIArchitecture #LLMOps #AgentSystems #EnterpriseAI #ProductionAI
33
Jun 11
🚀 Excited to have @neo4j supporting the launch of @RocketRideAI Cloud on June 18!
Graph-native data the harness that ships #AI to production, together!!!
7 days to @RocketRideAI Cloud 🚀
📍 SHACK15, SF | 📅 June 18
🎟️ Save your seat: lnkd.in/gfNdcy6J
🔗 Tell us what you're building on our Discord: lnkd.in/gKZhS8ZW
#ProductionAI #AILaunch #RocketRideCloud #AIDE

1
2
425

Jun 11
No demo prepares you for real production GenAI.
After shipping AI across healthcare, legal & media —
5 lessons kept showing up. Every. Single. Time.
💾 Save this before you swipe →
#FissionLabs #FloTorch #GenAI #AIEngineering #LLM #MLOps #ProductionAI
8
Jun 11
A working prompt is not the same thing as a production AI capability.
That distinction matters for enterprise AI. A prompt may solve one narrow task, but a real AI capability has a defined business job, explicit inputs, structured outputs, constraints, permissions, validation, logging, and rules that are enforced by code.
For example, “summarize this document” is too vague for production. A better capability would summarize a vendor contract for renewal risk, a support ticket for escalation, or an HR policy section for an employee-facing answer.
Those are different capabilities because the inputs, risks, business rules, and expected outputs are different.
For Microsoft-based organizations, this fits naturally with C#, .NET, ASP.NET Core, Azure OpenAI, SQL Server, SharePoint, Microsoft identity, Power Apps, Teams, workflows, and internal business systems.
The model call is only one part of the solution. The production-ready business function around the model is what turns AI into something reusable and governable.
The production workflow behind this video was built using the same methodology I apply for enterprise clients — I identified a real production bottleneck, evaluated AI options, and built a .NET-integrated workflow using AI tools to deliver it faster, better, and at lower cost. The thinking that improved my own workflow is the same thinking I bring to yours.
Explore more practical, applied enterprise AI insights at AInDotNet.com.
#EnterpriseAI
#AIArchitecture
#AICapabilities
#ProductionAI
#AIGovernance
#MicrosoftAI
#DotNet
#CSharp
#AzureOpenAI
#ASPNetCore
#SQLServer
#SharePoint
#PowerPlatform
#AIAssistants
#BusinessAutomation
#WorkflowAutomation
#SoftwareArchitecture
#AInDotNet
1
1
27

Most AI systems don't fail because the model is wrong. They fail because the surrounding architecture isn't production-hardened.
#LangGraph #vLLM #Django #ProductionAI #LLMEngineering #BackendEngineering #SoftwareArchitecture #AI

2
1
20
Here is the thing most people missed in Apple's big WWDC announcement. Tim Cook didn't just put Gemini inside Siri. He shipped a multi-model routing tier to 1.4 billion devices. Google, Anthropic, OpenAI, and third-party models now compete to answer your users' questions, and the OS decides who wins. That decision happens below your application layer. Below your MDM policy. Below anything your security team currently monitors.
So if your employees are on iOS 21 and asking Siri about a deal, a patient, or a financial account, you have no idea which AI backend just handled that query.
That is not a product update. That is a new compliance surface.
And on top of that, a 269-page federal AI bill just passed. It has mandatory incident reporting, liability for consequential decisions, and an 18-month compliance window that started the day it was signed.
Here is my take. The teams that get caught flat-footed are the ones treating both of these as IT tickets. They are not. They are architectural decisions. Who owns the routing layer? Who owns the audit log? Who owns the memory graph when OpenAI builds it on your users' behalf?
Read the full brief with hardware, robotics, research, and policy analysis: miketowery.substack.com/
Want a personalized intelligence brief built for your stack and sector? briefingiq.ai/
#AIArchitecture #LLMOps #AgentSystems #EnterpriseAI #ProductionAI
45
Jun 10
A working AI demo can create false confidence.
The data is clean. The examples are selected. The workflow is simple. The audience is forgiving. That can make a weak system look stronger than it really is.
Production is different. Real users bring messy inputs, missing information, unclear permissions, outdated documents, support expectations, logging requirements, and business risk. That is where many AI projects slow down or fail.
The practical takeaway is simple: do not confuse a demo with a production-ready AI system. A demo should create interest. A prototype should create evidence. Before moving toward MVP or production, prove that one reusable AI capability can survive real workflow conditions.
For Microsoft-based organizations, that means thinking about .NET integration, Azure OpenAI, security, SharePoint or Microsoft 365 data, SQL Server, logging, review, and support early enough to avoid expensive rework.
The production workflow behind this video was built using the same methodology I apply for enterprise clients — I identified a real production bottleneck, evaluated AI options, and built a .NET-integrated workflow using AI tools to deliver it faster, better, and at lower cost. The thinking that improved my own workflow is the same thinking I bring to yours.
Explore more practical, applied enterprise AI insights at AInDotNet.com.
#EnterpriseAI
#AIImplementation
#AIPrototype
#ProductionAI
#AIGovernance
#AIArchitecture
#MicrosoftAI
#DotNet
#AzureOpenAI
#AIAssistants
#BusinessAutomation
#WorkflowAutomation
#SharePoint
#SQLServer
#Microsoft365
#SemanticKernel
#MVP
#AIAdoption
#AInDotNet
2
2
66
Yale's Chief Executive Leadership Institute just published a governance framework for agentic AI, and it was triggered by one model: Anthropic's Claude Mythos Preview. Eight specific variables. Authorization scope, action reversibility, context boundaries, human checkpoints, audit trails, data residency, inter-agent trust, escalation routing. That's the list.
Here's what matters. This isn't an ethics document. It's a system design checklist. And if you're running agents in production right now, you probably have gaps in at least four of those eight areas.
The context window problem is the one I keep coming back to. Mythos Preview has a two-million-token context window. That means an agent can see enough of your organization to take real, consequential actions without asking anyone. Enterprise pilots found credential-adjacent data surfacing in outputs that existing monitoring didn't catch. That is an authorization failure, not a model failure.
So my take is this: the teams that treat context assembly as a security perimeter, not just a performance setting, are going to be the ones who don't end up in a Yale case study about what went wrong. Build the controls now, before the regulation makes it mandatory and expensive.
Get the full analysis at miketowery.substack.com/
If you want a personalized intelligence brief, check out: briefingiq.ai/
#AIArchitecture #LLMOps #AgentSystems #EnterpriseAI #ProductionAI
1
1
44

Jun 10
If you've got a gateway routing every LLM call in your company, you're at Stage 1 of AI transformation.
Stage 2 is one AI agent in production. People actually use it.
The move is simple. Pick one workflow. Write down what good looks like. Build with a human in the loop. Ship the eval before the model. Every thumbs-down becomes next sprint's fix.
That's where AI starts paying back.
For CIOs and Heads of Engineering at BFSI firms in India.
#AIinBFSI #AITransformation #ProductionAI #LLMOps #EngineeringLeadership
2
114
Jun 9
Faster AI usually means a smaller model or a shorter prompt. This hackathon team did neither.⚡
They moved their pipeline onto @RocketRideAI and went from 5-7 min reports to under 2.5, by fixing the infrastructure, not the prompt.
Latency handled at the runtime level. PII redacted, sentiment scored, entities extracted, before the model ran. Full project breakdown coming soon. 🎥
That was all built on our open source. Now we're bringing it to the cloud!!
🚀 RocketRide Cloud launches June 18th at @SHACK15sf , See more details here: luma.com/f7klujxs?tk=sR4ut8.
#ProductionAI #AIInfrastructure #LLMOps #RocketRideCloud
42