
18 Nov 2025
Look what I make with #rprogramminglanguage
Sorry it slow and doesn't run smoothly, my computer is tired.
2
4
16
939

20 Oct 2025
How difficult is your programming language?
#programmingjoy #programmermode #code #programmingmodel #cpp #cppprogramming #rprogramminglanguage #SQL #sqlknowledge

1
3
36

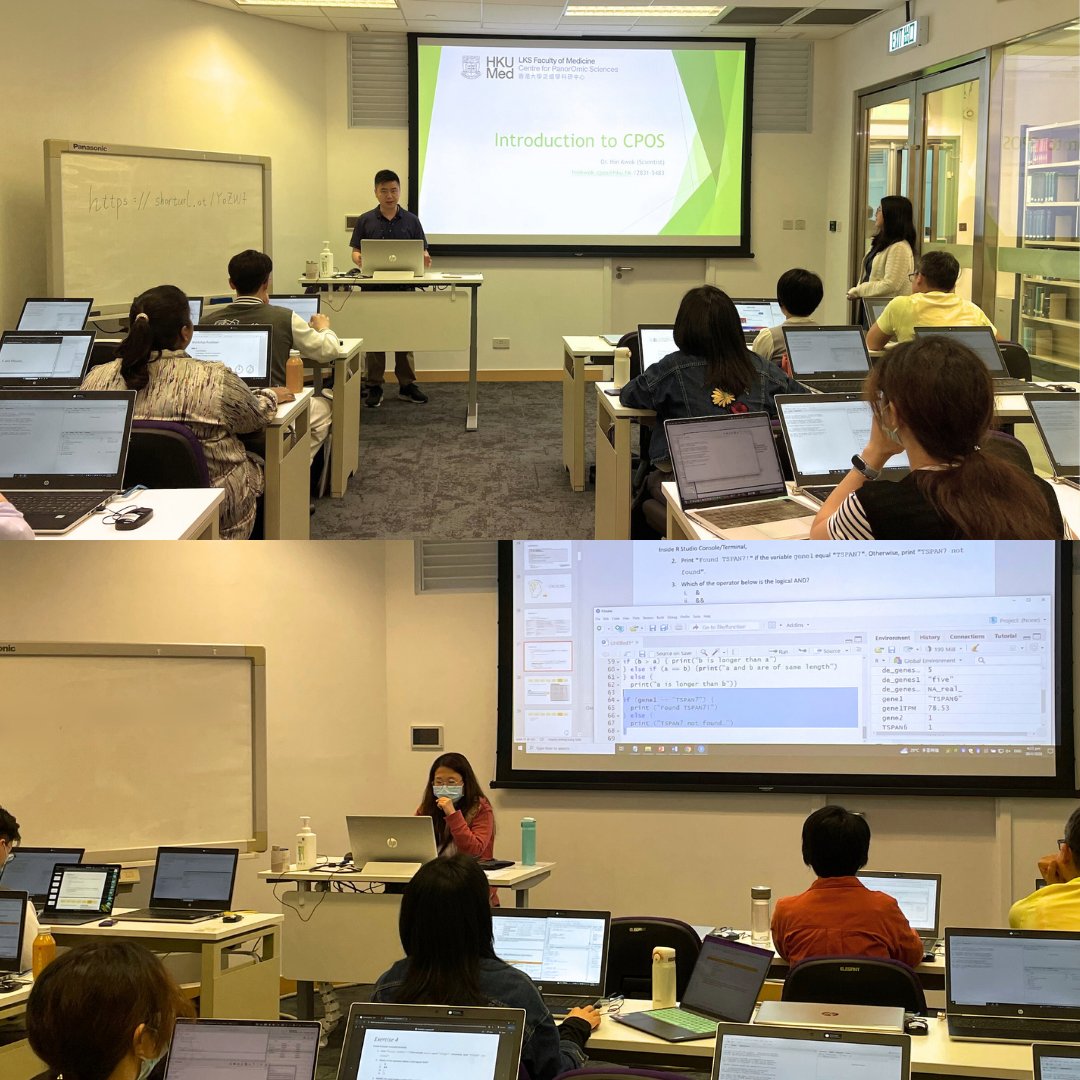
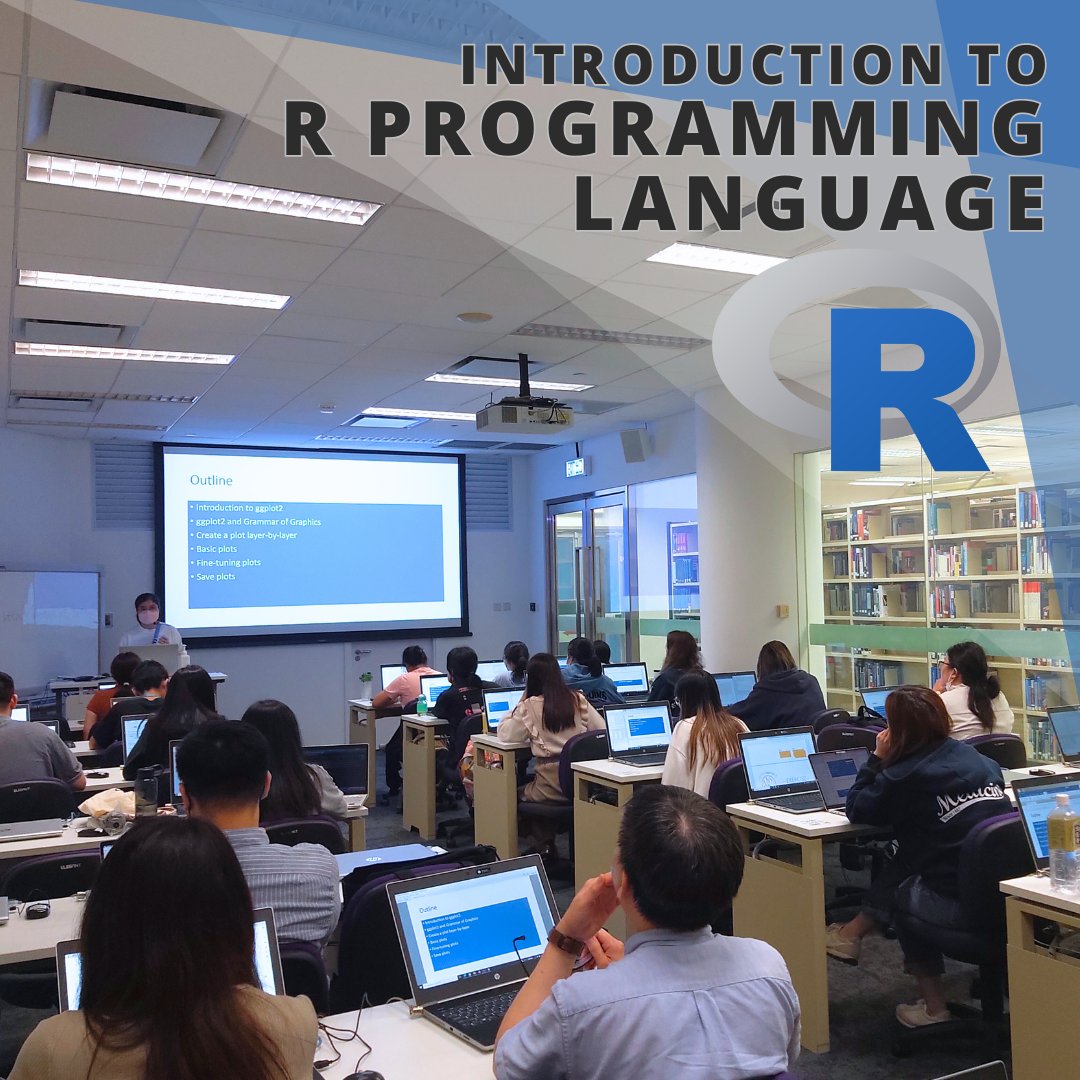
Introduction to R Programming Language🎉🖥️
🙋🏻♂️For more information about CPOS Bioinformatics Core, feel free to contact us!
#HKUCPOS #CPOS #HKUMed #HKU #ConnectWithUs #SassoonRoad #BioinformaticsWorkshops #RProgramming #RProgrammingLanguage #DataManipulation #BiologicalData
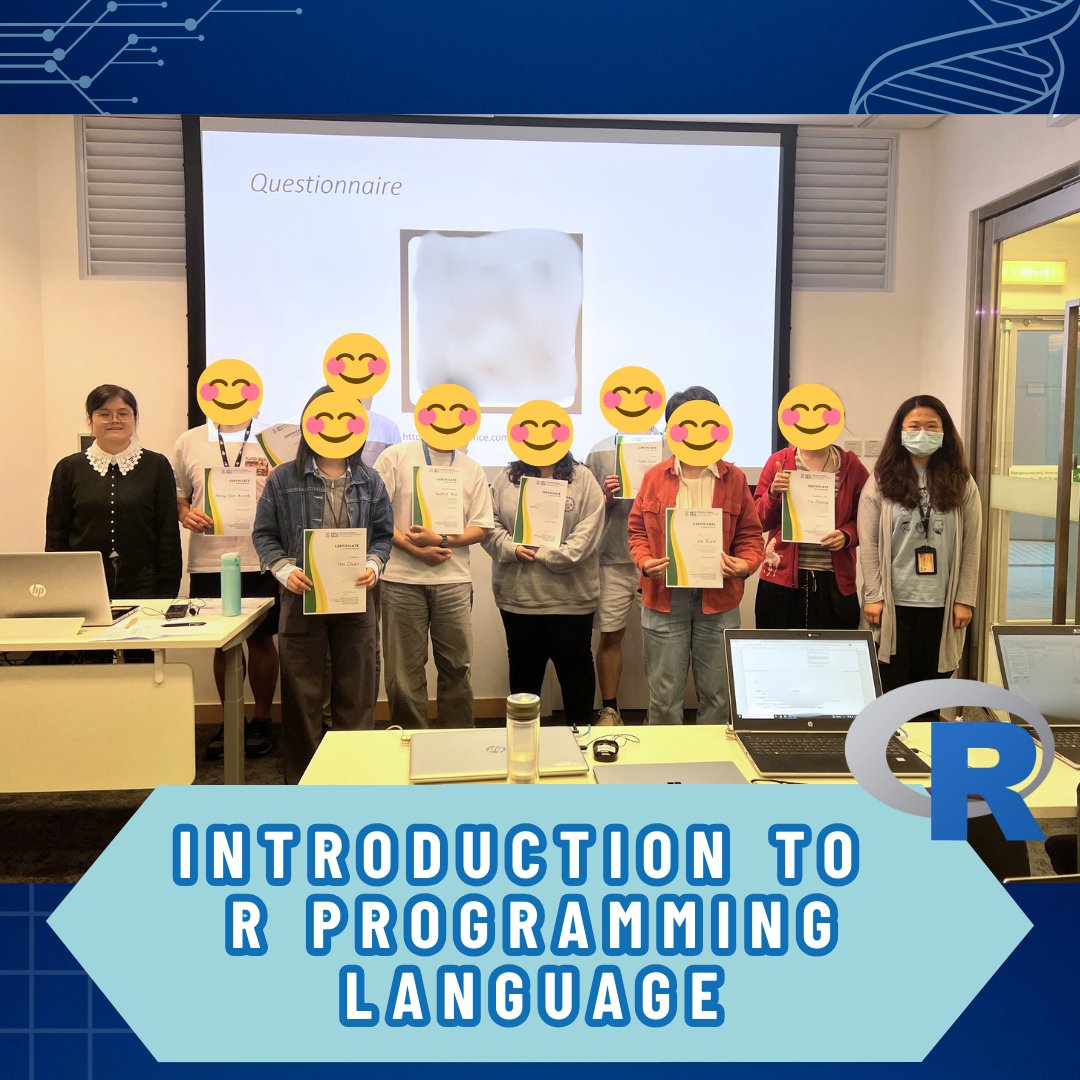
ALT The workshop was tailored for beginners of R programming, focusing on utilizing R for manipulating biological data tables, and integrating advanced AI applications into coding practices.
ALT Heartfelt thank you to all participants for their unwavering support🥰 Looking forward to seeing you at our next bioinformatics workshop😊
3
79

30 Sep 2024
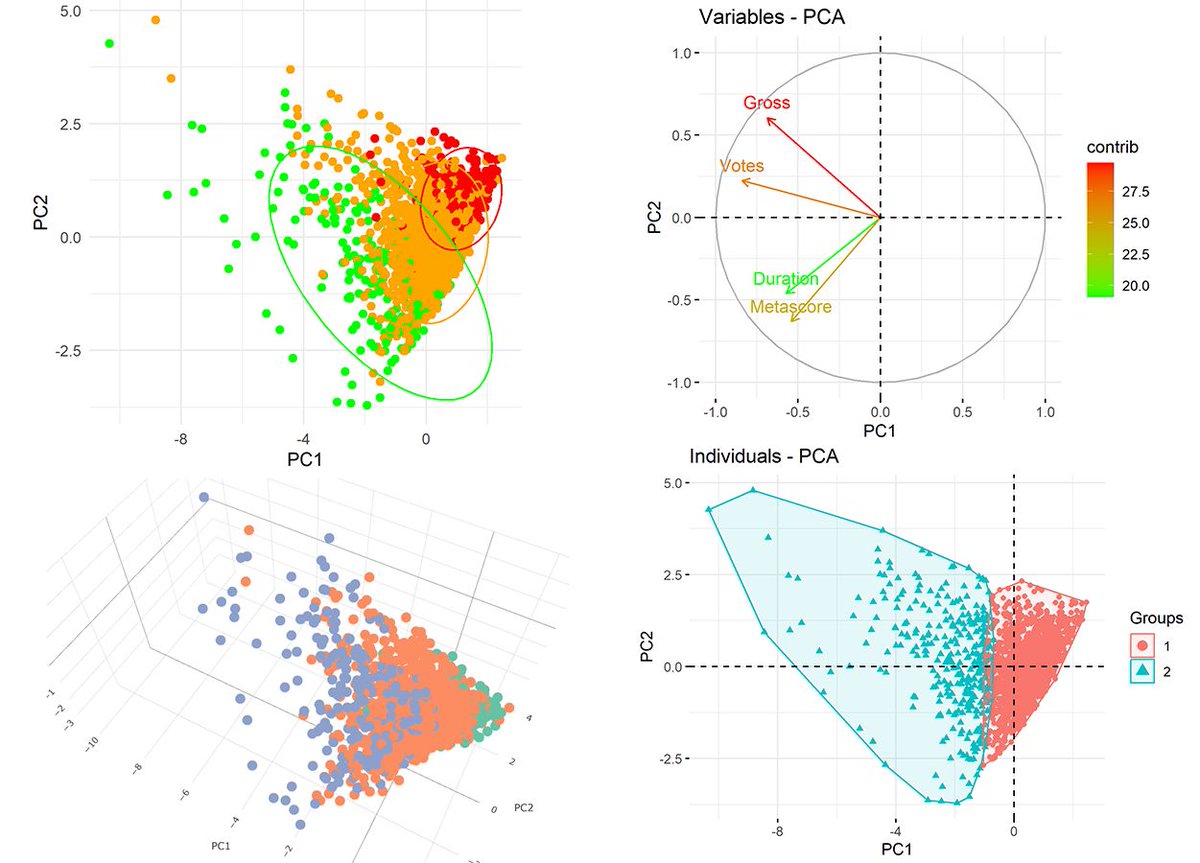
Principal Component Analysis (PCA) is a powerful statistical tool used to simplify complex data sets by transforming them into a set of linearly uncorrelated variables called principal components. This technique is highly beneficial for visualizing your data, especially when dealing with high-dimensional data. Here's why PCA is a game-changer:
✅ Reduces Complexity: PCA helps in reducing the dimensionality of the data while retaining the most informative features. This makes it easier to explore and interpret the underlying patterns in the data.
✅ Improves Visualization: By compressing multiple dimensions into just two or three principal components, PCA allows us to visualize complex data in a 2D or 3D space. This is ideal for spotting trends, clusters, and outliers that may not be obvious in higher dimensions.
✅ Enhances Understanding: The transformation of data to principal components can reveal relationships between variables that are not apparent in the original data. This can lead to better insights and more effective decision-making.
✅ Speeds Up Other Analyses: By focusing on the components that account for the most variance, PCA can speed up other data analysis techniques, reducing computational costs and enabling quicker results.
Looking to explore PCA using R? Enroll in our Statistics Globe online course to boost your data analysis expertise! Take a look here for more details: statisticsglobe.com/online-c…
#research #dataanalytics #programming #data #rprogramminglanguage
1
78
400
18,047
29 Sep 2024
Folium is a powerful Python library that lets you create stunning interactive maps using Leaflet.js. It's a fantastic tool for visualizing geographic data in a dynamic and engaging way.
With Folium, you can transform your data into beautiful maps with minimal effort, making it perfect for data analysts, geographers, and anyone interested in geographic visualizations.
Key features of Folium include:
✅ Ease of Use: Create maps with just a few lines of code.
✅ Integration: Easily integrates with Python data analysis libraries like Pandas and Jupyter notebooks.
✅ Rich Visuals: Supports a wide range of map tiles, markers, and interactive elements.
Here's a comparison with other popular mapping libraries:
1️⃣ Folium vs. Matplotlib/Basemap: While Matplotlib with Basemap offers extensive customization and is great for static maps, Folium excels in interactivity and ease of use. Folium’s integration with Leaflet.js makes it more suitable for web-based applications.
2️⃣ Folium vs. Plotly: Plotly also provides interactive map capabilities. However, Folium is specifically tailored for geographic data, offering more detailed map options and a simpler interface for map-specific features.
3️⃣ Folium vs. Geopandas: Geopandas is excellent for handling and analyzing geospatial data, but when it comes to visualization, Folium provides a more interactive and visually appealing output.
One of the standout advantages of Folium is its seamless integration with Jupyter notebooks, making it an excellent choice for interactive data exploration and presentation.
Check out the detailed documentation and examples here: python-visualization.github.…
If you're passionate about data science, statistics, Python, and R programming, consider subscribing to my free email newsletter for regular tips and insights! More information: eepurl.com/gH6myT
#analysis #datastructure #rprogramminglanguage #advancedanalytics #dataanalytics

9
23
1,770
7 Sep 2024
Evaluating the normality of your data is crucial in statistical analysis, as many techniques assume that the data follows a normal distribution. The QQ plot (Quantile-Quantile plot) is a simple yet powerful tool to visually assess this.
✔️ Improved Model Accuracy: Properly handled, QQ plots help confirm that your data meets the assumptions required for many statistical methods, leading to more reliable results.
✔️ Enhanced Data Insights: By detecting deviations from normality, you can make informed decisions about data transformations or the choice of statistical methods.
❌ Misleading Results: If normality is not checked, you may apply inappropriate statistical techniques, leading to incorrect conclusions.
❌ Overlooked Data Issues: Failing to evaluate normality might cause you to miss out on important patterns or outliers in your data.
When interpreting a QQ plot, you are looking for how closely the points follow the reference line.
🔹 Normal Distribution: If the data follows a normal distribution, the points will align closely with the diagonal reference line.
🔹 Non-Normal Distribution: If the points significantly deviate from the line, this indicates that the data is not normally distributed. The nature of the deviation can provide insights into whether the data is skewed, has heavy tails, or other issues.
The visualization in the post contrasts two QQ plots: the left plot shows a data set following a normal distribution, where the points align closely with the reference line. The right plot displays a data set with non-normal distribution, where points deviate significantly from the line.
Curious about how to create QQ plots in R? Check out this tutorial: statisticsglobe.com/r-qqplot…
If you want to learn more about statistical methods in R, check out my online course on Statistical Methods in R, starting on September 9, 2024, which covers this topic and others in further detail.
Learn more: statisticsglobe.com/online-c…
#datavisualization #rprogramminglanguage #programming #datastructure #visualanalytics #database

5
53
350
29,799

28 Aug 2024
Can I outsource the creation of my Postgres SQL table to my cat? She's good with paws!
Source: devhubby.com/thread/how-to-c…
#rprogramminglanguage #techlearning #dataanalytics #database #user #bestshirtever
6
15


Our workshop on 26/4 introduced participants to basics of R and RStudio. With practical sessions focused on manipulating biological data tables, participants gained valuable hands-on experience.
#Bioinformatics #RProgramming #RProgrammingLanguage #DataManipulation #BiologicalData
1
3
433

13 Jan 2024
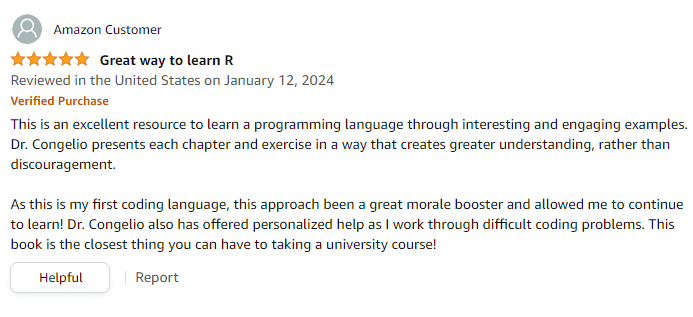
I wanted Introduction to NFL Analytics with R to be just that - a gentle introduction to learning coding and analytics that presents the information and lessons in a jargon-free and step-by-step fashion.
Needless to say, I am thrilled to read this review of the book on Amazon:
"[The book's] approach has been a great morale booster and allowed me to continue to learn. Dr. Congelio also has offered personalized help as I work through difficult coding problems. This book is the closest thing you can have to taking a university course."
The book is currently a #1 new release on Amazon and you can purchase your copy here:
amzn.to/3Sev3JI
#NFLPlayoffs #NFL #rstats #rstudio #coding #rprogramminglanguage
3
17
8,805

28 Dec 2023
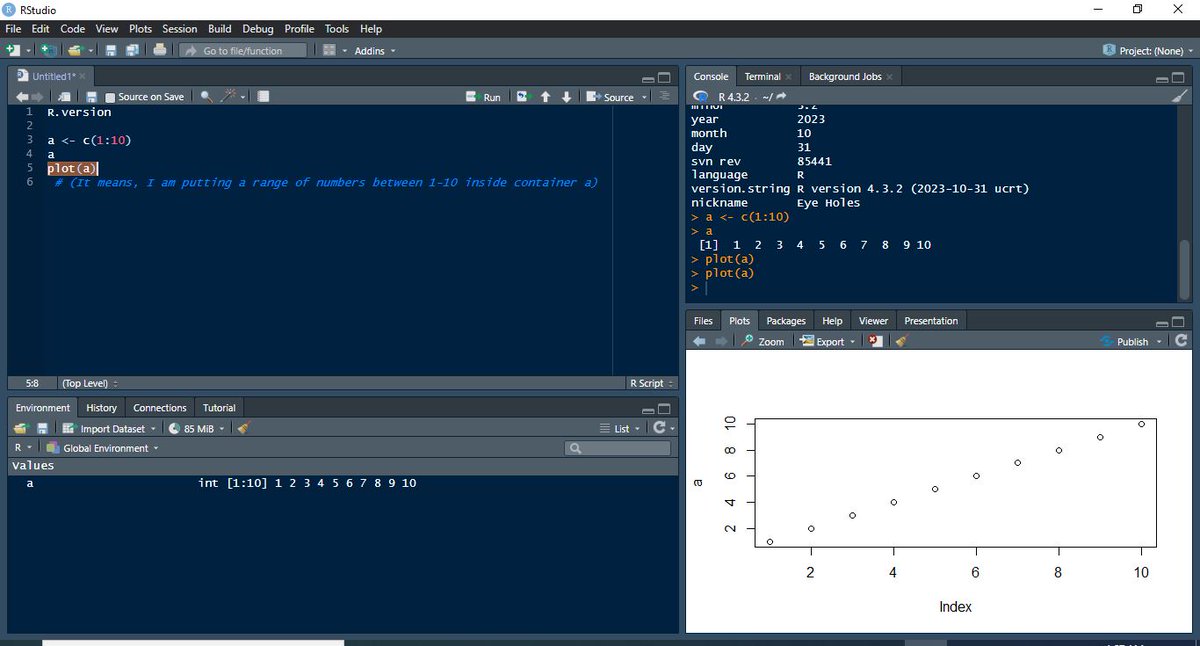
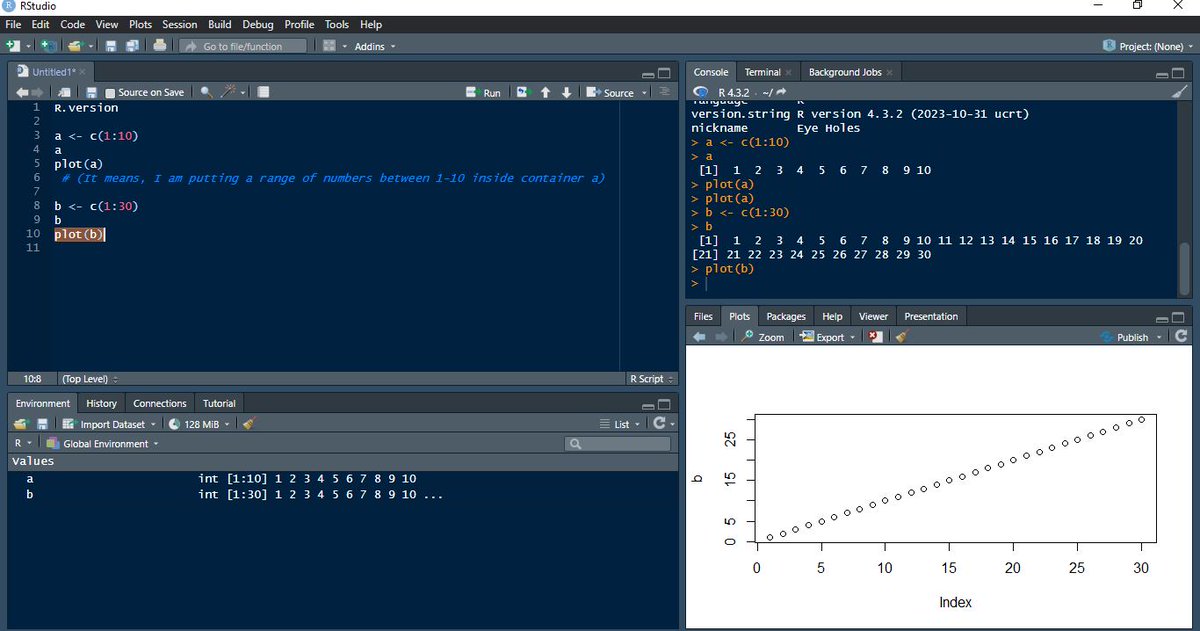
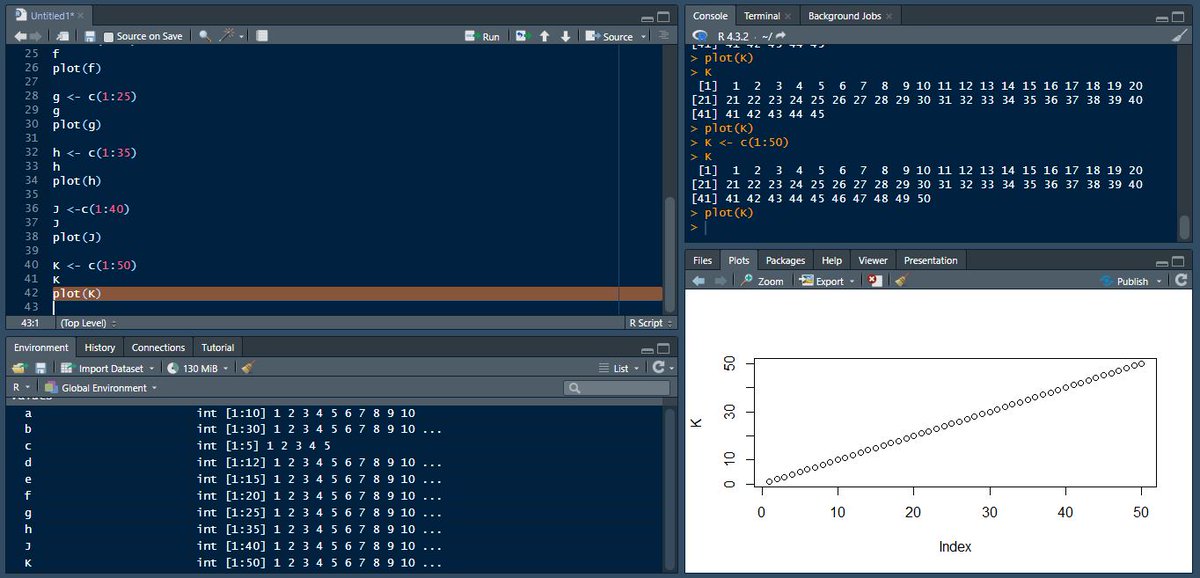
Did you know that the R programming language is case-sensitive? In other words, "a" is not the same as "A" - R sees them as two completely different values.
We've kick-started our basics journey in R @VephlaUni and plotted basic charts.
@DevTobs
#RProgrammingLanguage!!

4
197

6 Oct 2023
Want to Know About, R Programming Language and Set Up an R-Development Environment On GCP(Google Cloud Platform), Check out this Amazing Blog Post and share your thoughts! 🚀
#gcp #DataVisualization #DataAnalysis #RStudio #RProgrammingLanguage
link.medium.com/JN7KMIX2FDb
1
284

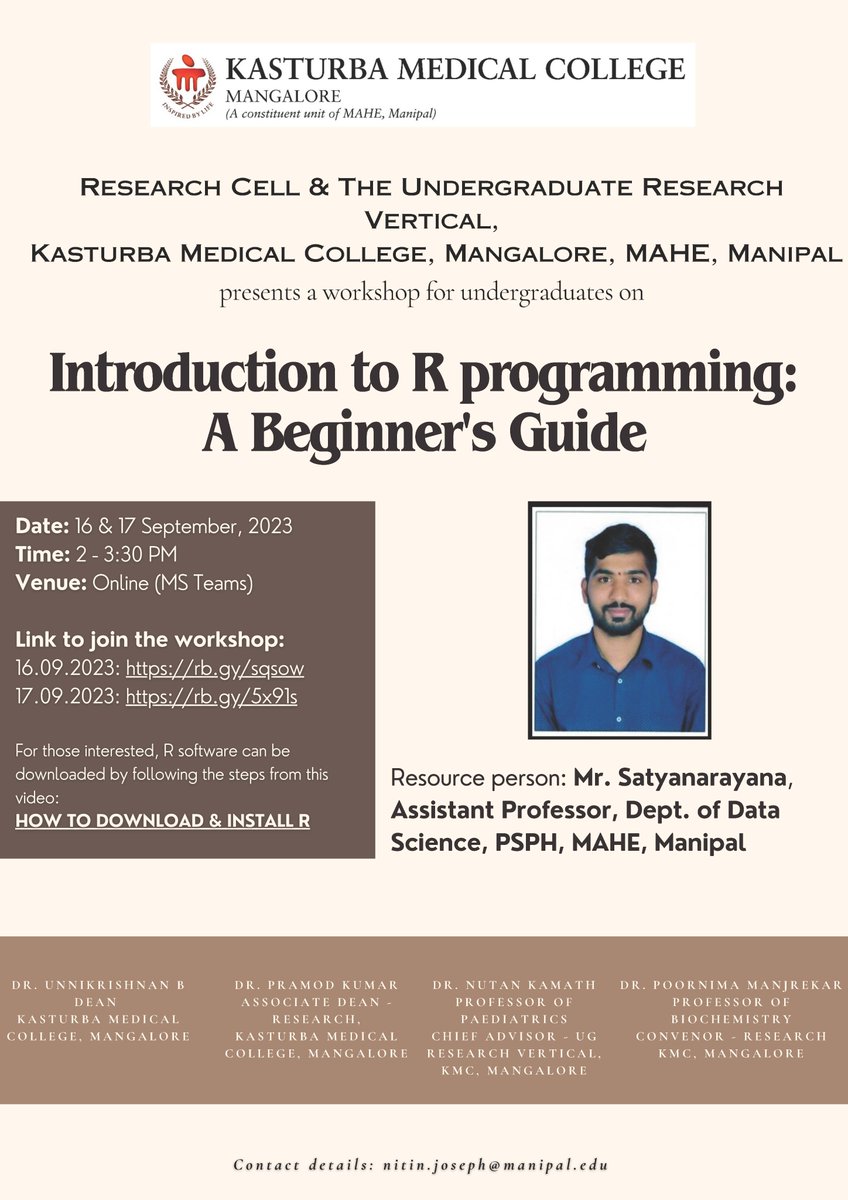
13 Sep 2023
A great opportunity for undergraduates to learn more about statistical analysis of research data
#rprogramminglanguage #statistics #data #analysis #research
3
11
763

25 Aug 2023
New certification: Training on Advanced Statistics and Experimental Design from RUFORUM Network and The World Bank! Using #rprogramming #rprogramminglanguage
#datascience #datascientist #datascienceinternship #datasciencejobs #dataanalytics #experimentaldesign #RStats #Rstat
1
8
701

18 May 2023
🚀 Discover the power of #GWAS with our special guest, @AndyChen_Wheat!
📅Sat, May 27, 2023 ⏰1-3 PM CET 🌐Zoom
Secure your spot: lnkd.in/ew89m6kY
Start your #bioinformatics journey now!
#RStats #R #rprogramminglanguage #rprogramming #datascience #computationalbiology

2
5
1,450
17 May 2023
Do you want to get familiar with #gwas analysis in #R?
🗓️ Saturday, May 27th, 2023
⏰ 1:00 PM to 3:00 PM CET
📌 Zoom
👉 Registration link: tinyurl.com/3nb324xh
#computationalbiology
#bioinformatics #rprogramming #rprogramminglanguage #rstudio #rstats

3
38
116
21,804

6 Feb 2023
Workflow Automation and Its Advantages in 2023
Read here: ptt.technology/2023/02/workf…
#PTT #PTH #webdevelopment #trendingnews #techtrends #perfecttimingtechnologies #technologytrends #technology #techdaily #interestingtechnology #technologysolutions #tech #rprogramminglanguage
3
57
26 Jan 2023
How to Improve your Small Business in 2023?
Read here: ptt.technology/2023/01/how-t…
#PTT #PTH #webdevelopment #trendingnews #techtrends #perfecttimingtechnologies #technologytrends #technology #techdaily #interestingtechnology #technologysolutions #tech #rprogramminglanguage

1
2
58

26 Jan 2023
One Day Workshop by Codanics
Learn " R with Dr. @aammar_tufail " on this Saturday for Data Science.
Don't miss the opportunity. Free Workshops won't hurt you.
#RProgramming #rprogramminglanguage #datascience #dataanalysis #codanics

2
273
20 Jan 2023
Data Management and Its Relevance
Read here: ptt.technology/2023/01/data-…
#PTT #PTH #webdevelopment #trendingnews #techtrends #perfecttimingtechnologies #technologytrends #technology #techdaily #interestingtechnology #technologysolutions #tech #rprogramminglanguage #cybersecurity
2
72