
Apr 5
If you made it this far, you might be wondering how this project came to be. I wrote more words about that.
Apr 2

On May 2, 1982, the @weatherchannel went live at the National Cable Association convention in Las Vegas. From day one, personalized local forecasts were core to the mission. In order to pull this off, The Weather Channel engineered specialized WeatherStar hardware, got lucky on a satellite deal, and worked directly with the @nws to standardize their weather data. This ingenuity allowed local cable providers to show personalized weather, a format which really shined in the mid 90s when it was shown on the 8s of the hour.
As soon as Rohit Agarwal, a fellow @soundcloud alum, became the CEO of the @weatherchannel, I slid into his DMs. I mentioned my love for the weather, the company, and was open to opportunities to work together if we could find the right project. Naturally, I knew the starting point had to be a recreation of the retro broadcast. Ever since this format quietly faded in the early 2010s, fans of the @weatherchannel documented and built incredible homages of their own. The real question: how do we set ours apart?
I took an approach of retrofuturism. What if technology evolved but the @weatherchannel aesthetic did not? How would I recreate this format using best practices within the confines of a 90s design language? First, I spent countless hours in my notebook considering how the 4:3 ratio layout could be responsive to mobile screens. I then engineered a broadcast system which would autoplay the visual on the 8s (08, 18, 28, 38, 48, 58) of the hour and even allow for late joins. So, if you visit the site at 6:19am, you’ll be placed 1 minute into the broadcast. I also thought deeply about internationalization and have so far translated the app into 20 different languages, including adding Arabic RTL support. This makes the format accessible to locations which never had access to it. Naturally, the vibes and smooth jazz are there too.
In a time when information seems to be immediate, abundant, and abrasive, RetroCast Now harks back to a time of slow data consumption. I hope it is calming, nostalgic, and useful.
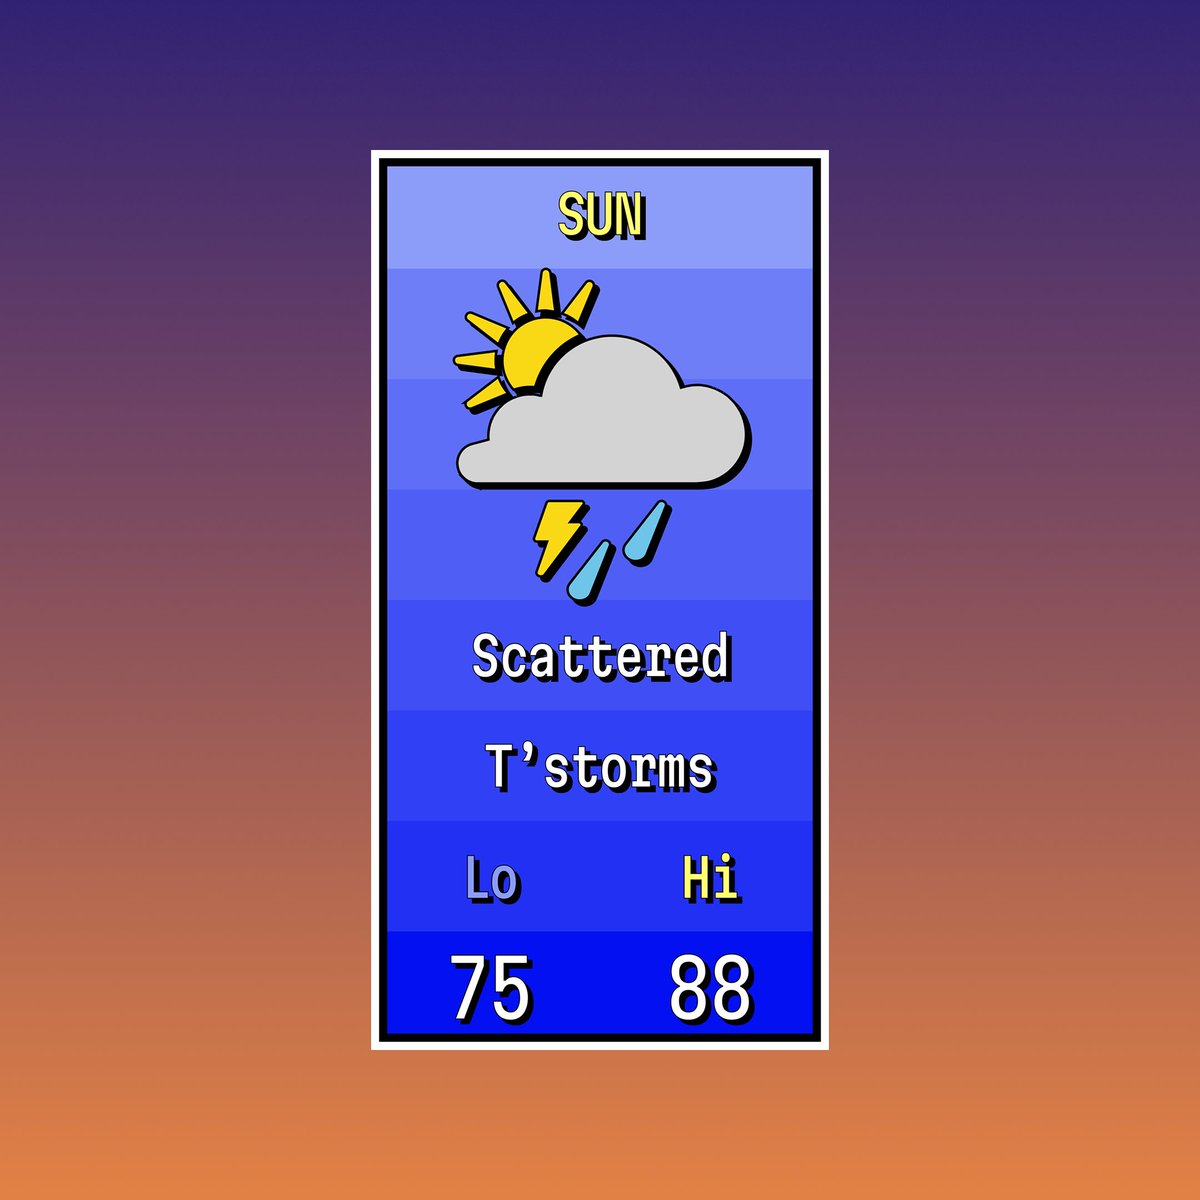
And now… your local forecast:
weather.com/retro
Thanks to the @weatherchannel for the opportunity of a lifetime.
I dedicate this project to my Mom.
5
446
Apr 4
Special shout out to @evilmartians for their Martian Mono font. It ended up being the perfect alternative to the original typeface and had the benefits of variability. fonts.google.com/specimen/Ma…
1
4
14
2,106
Apr 4
I was able to add 20 languages (so far) using the @nuxt_js i18n module, which ended up being a lot of fun. i18n.nuxtjs.org/
1
2
378
Apr 4
The TV turn on effect is just come careful CSS animating. And, the countdown screen was inspired by classic @weatherchannel bumper/intro graphics.
1
3
372
Apr 4
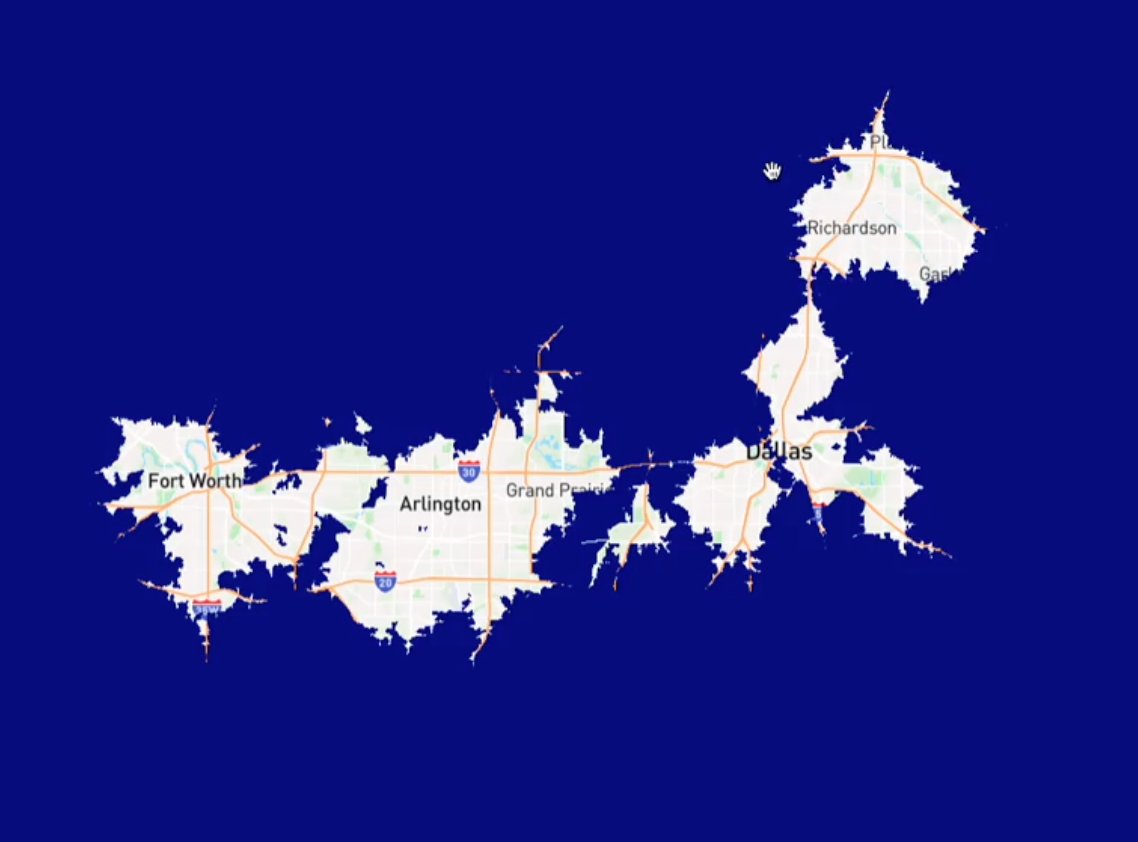
To choose which regional locations were shown on the regional forecast and the latest observations screens, I actually created a local database of major cities. This allowed for a more controlled visualization. Then I just used @turfjs to find the best locations near the user.
1
2
386

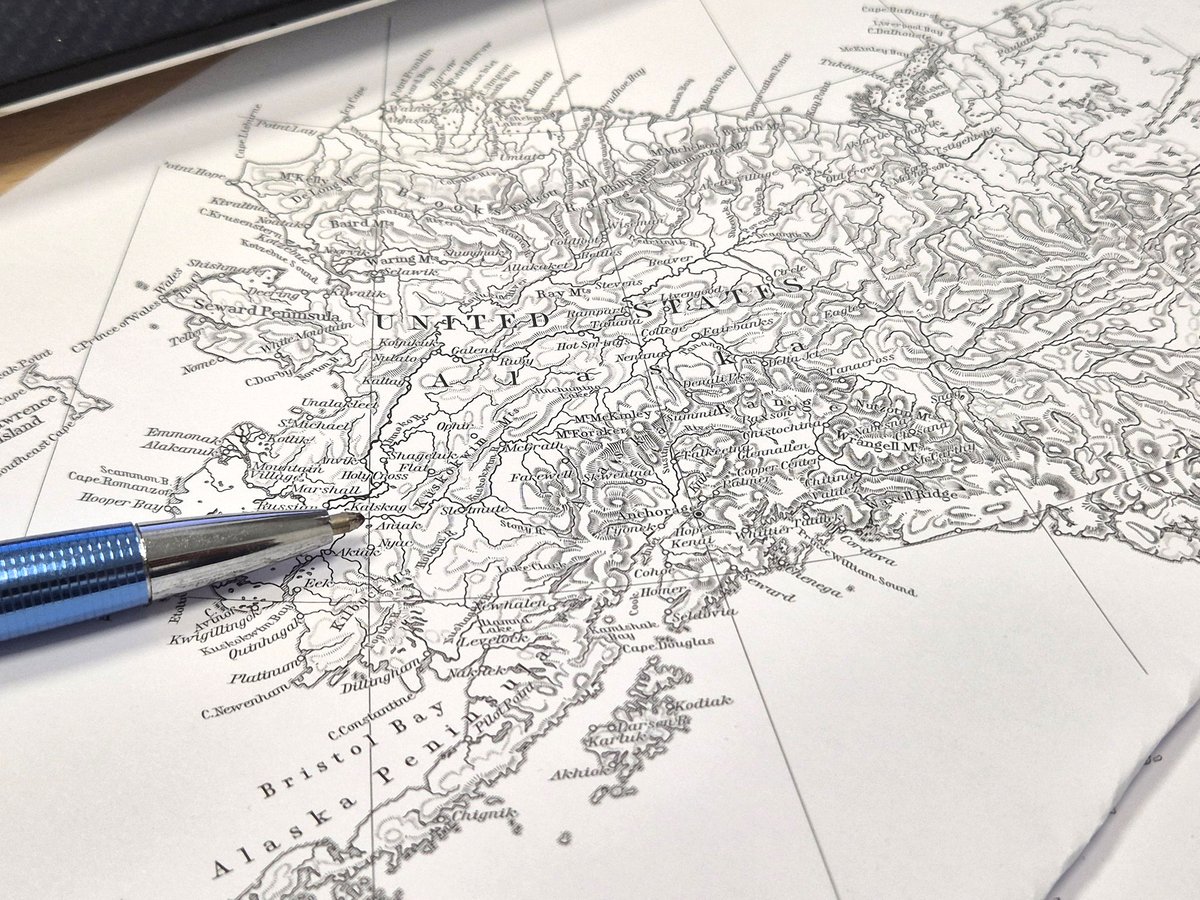
I have been using turfjs for similar tasks, when preparing map layers for pen-plotter output.
turfjs.org/
2
84

6 Dec 2025
Merci bien. C'est la fonction isobands de turfjs que je n'avais pas trouvé il y a trois ans.
3
396

24 Nov 2025
For Day 24 of #30DayMapChallenge: Places and their names, a labeling trick in mapgl you can try.
Use the TurfJS integration in the package to dynamically compute centroids for your layer then use them as a symbol layer to label your polygons.
Try it: gist.github.com/walkerke/b77…
1
17
1,582
3 Oct 2025
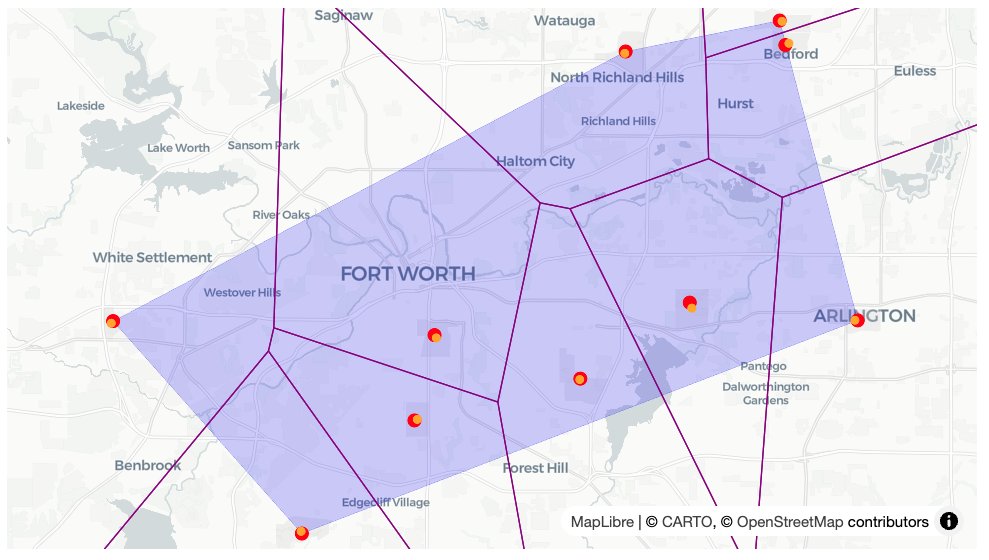
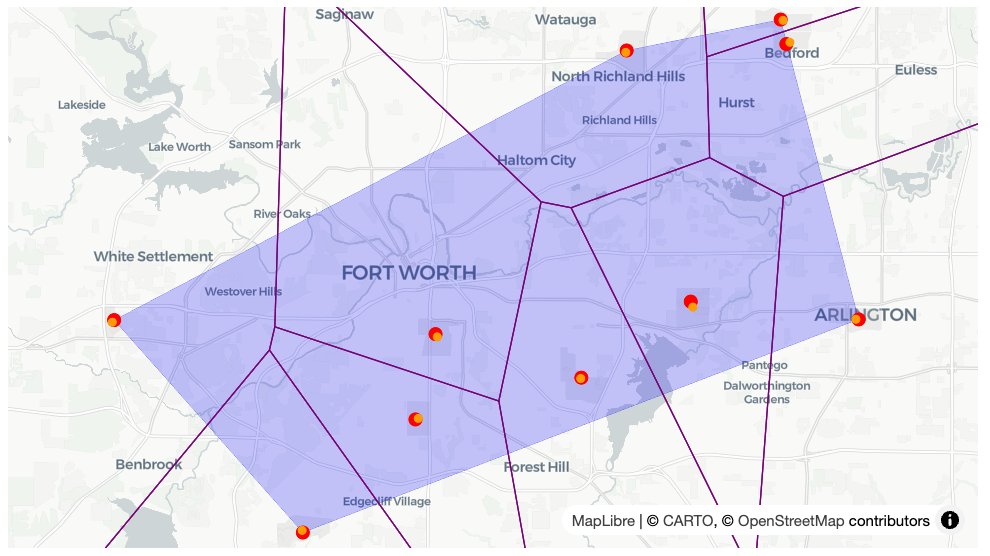
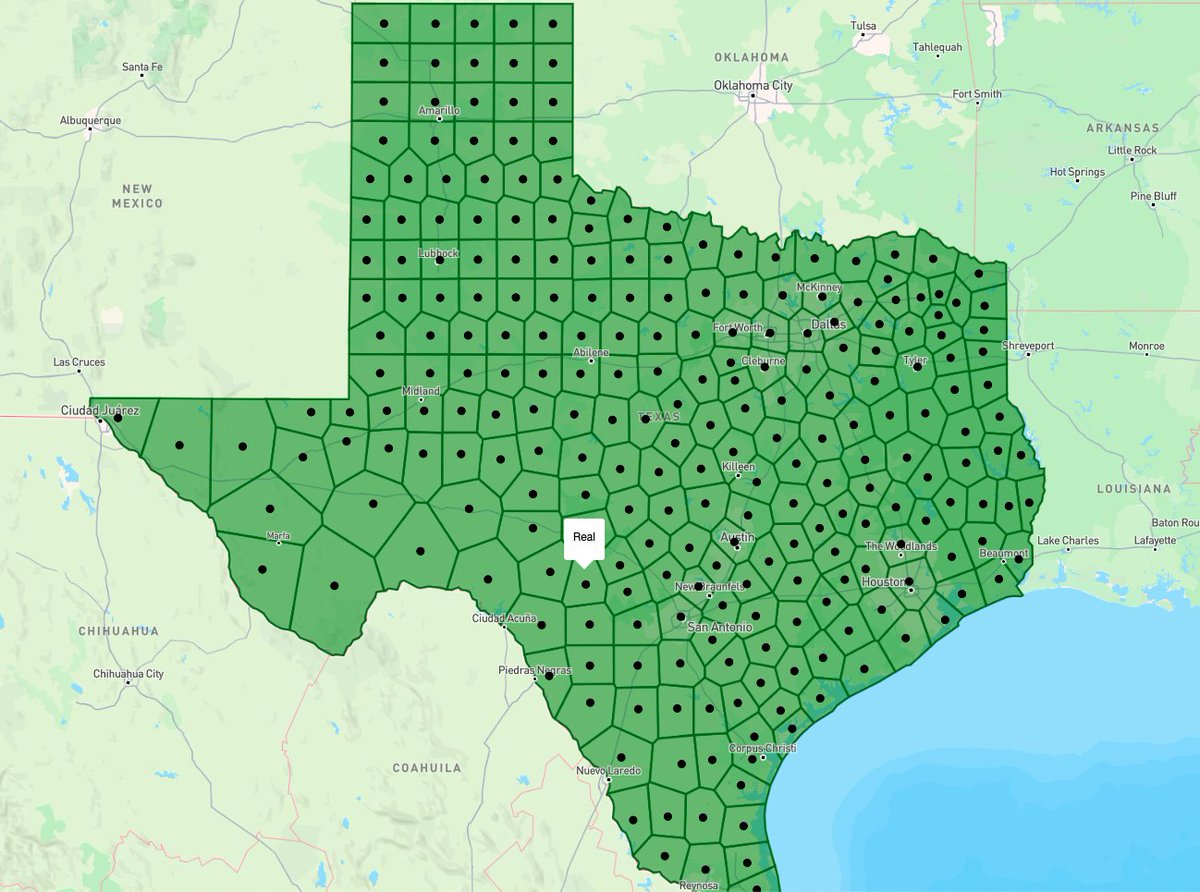
Real-time spatial analysis in your R Shiny apps?
The {mapgl} package - and its TurfJS integration - make it possible.
Watch as Voronoi polygons instantly update on marker drag.
Pick a metro and try it out: gist.github.com/walkerke/f4d…
2
22
117
4,511
16 Sep 2025
A cartographic use-case for mapgl's TurfJS integration: calculate centroids on-the-fly for polygon labels.
Shown here: we map Census data; get the centroid with Turf's center of mass function; then use that for a symbol layer to make a custom label.
2
9
47
1,893
21 Aug 2025
A new release of the {mapgl} #rstats package (0.4.0) is now on CRAN with support for spatial analysis with TurfJS!
Featuring:
🌎 #GIS operations like buffer, clip, & erase;
🌎 Spatial filtering;
🌎 Voronoi polygons & convex/concave hulls;
And more!
walker-data.com/mapgl/articl…

16
66
2,728
15 Aug 2025
So what started as a "thought leadership" post idea has now turned into a TurfJS R wrapper for you all to use: walker-data.com/mapgl/articl…
1
2
371
12 Aug 2025
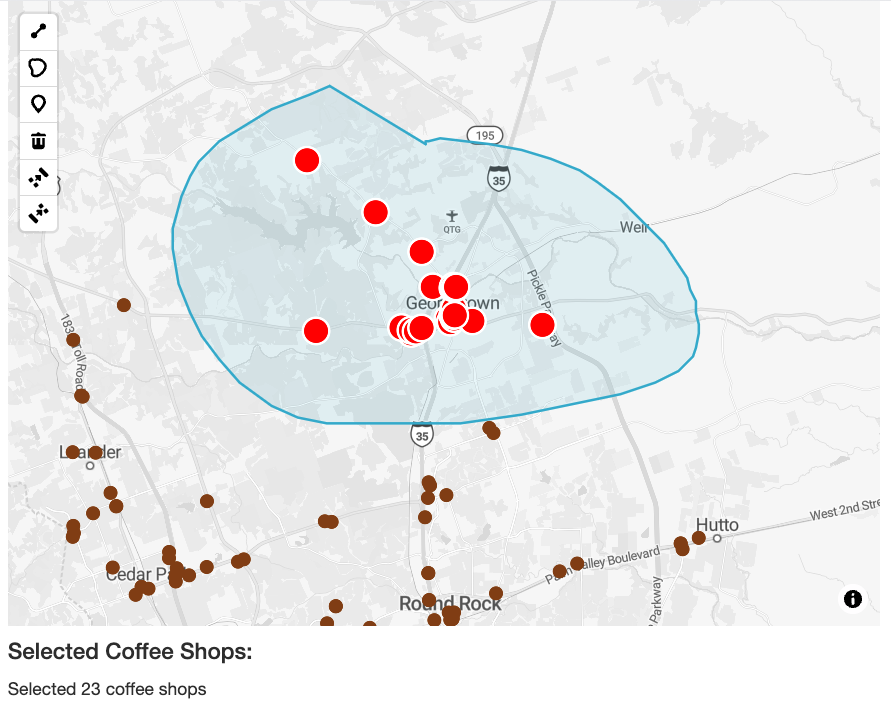
Using drive-time isochrones on-click as a "cookie cutter" on an interactive map?
Why not!
(And it's all done with R code)
Learn how to use TurfJS in #rstats here: walker-data.com/mapgl/articl…
1
4
615
9 Aug 2025
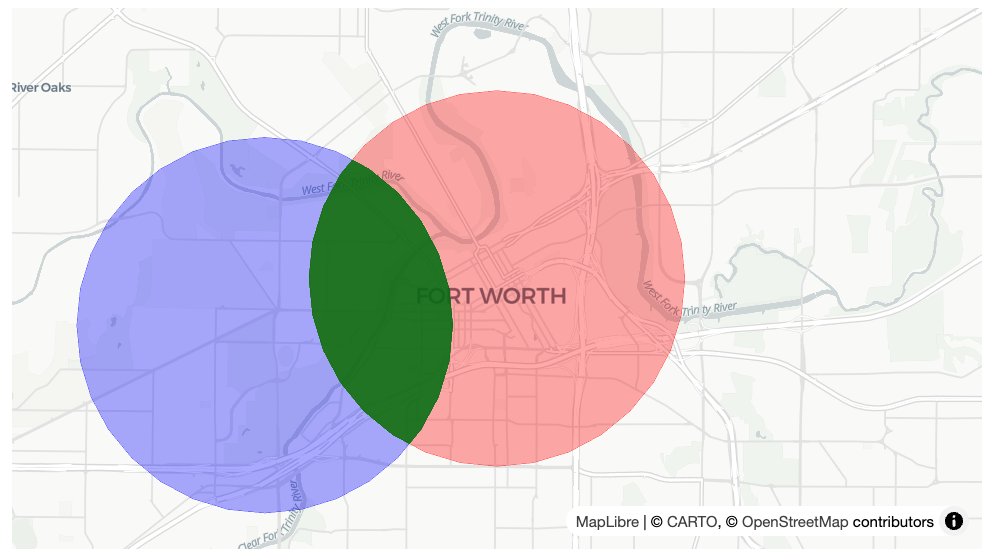
In-browser spatial analysis pipelines with buffers, spatial filters, convex hulls, and more - but all you need is R code, no JavaScript required.
Learn how in the new mapgl vignette: walker-data.com/mapgl/articl…
#rstats #GIS #turfjs


3
24
1,837
8 Aug 2025
mapgl's new TurfJS integration brings interactive geospatial analytics to #rstats & Shiny.
Shown here: Voronoi polygons that increment on user click - all in the browser, but written with R code!
Blog posts are in the works; right now check out the docs: walker-data.com/mapgl/articl…
1
3
19
1,293
7 Aug 2025
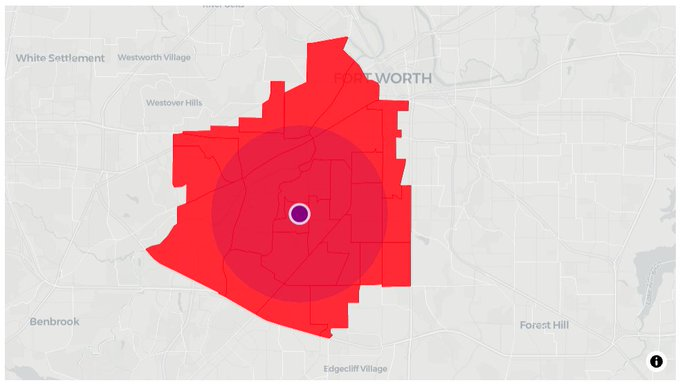
Client-side GIS analysis in #rstats via TurfJS is now possible in the {mapgl} package!
Calculate buffers, intersections, spatial filters, Voronoi polygons, and more *in the map*
This is HUGE for performant spatial analysis in Shiny apps.
Vignette: walker-data.com/mapgl/articl…

2
4
443

19 Apr 2025
“Handmade maps in the digital world” is my bailiwick, here are 23 modern map artisans:
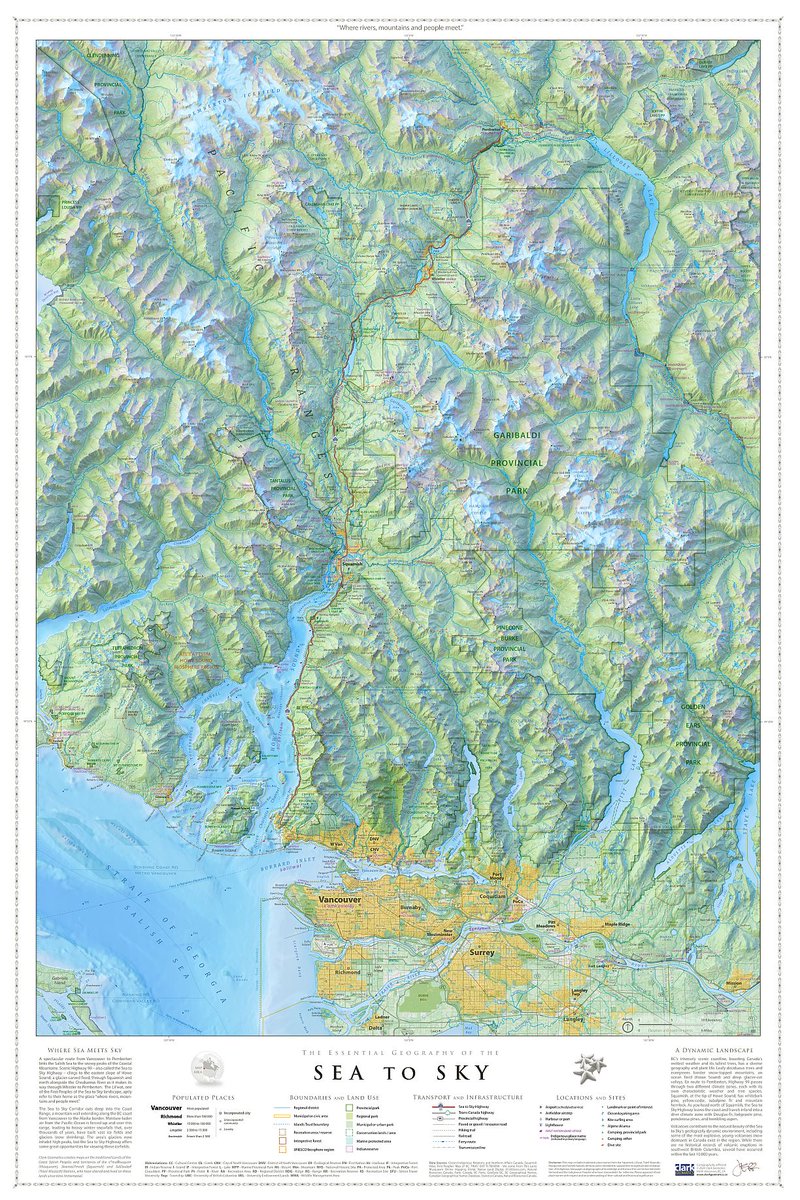
@ClarkGeomatics Jeff Clark completed a 100-layer 18-month project to map the Salish Sea.
@MtnMapper Tom Patterson spent decades mapping for the National Park Service, still releases a banger map every few months AND releases his design files to the public domain.
@DonatasBruzas Donatas Bružas is working on an engraving-style 3 ft. globe, makes custom typefaces and the most beautiful computer-mediated hachures you’ve ever seen.
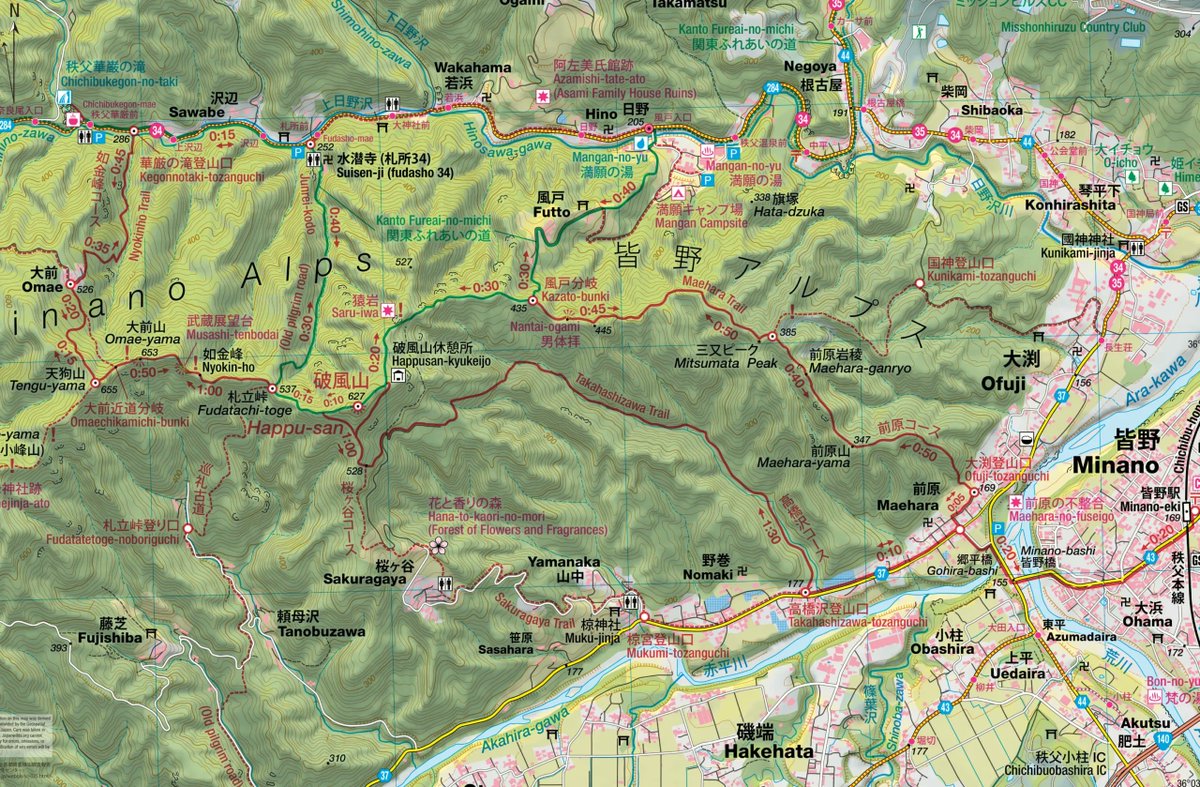
@JapanMapping Markus Hauser, trained in Switzerland with decades of experience, makes the best trail maps of Japanese wilderness.
@FleischerHannes Hannes Fleischer wanted an old-school pen plotter map, so he lathed and milled his own parts to build the plotter, wrote custom scripts to turn DEMs into hachures, and designed the map with turfjs.
Henrik Jonasson made an acre-sized handmade topo map of Sweden
tiles.calazoffice.biz/#65567…
hkartor.se/
Mike Hall’s incredibly thick reference maps (he draws his own coastlines)
thisismikehall.com/europe
Dave Imus’s 5 ft. wide maps of the U.S.
imusgeographics.com/
Alex McPhee’s 6 ft. maps of Canadian provinces
pronghornmaps.com/saskatchew…
Andrew Lynch spent years tracking down every NYC rail siding
vanshnookenraggen.com/_index…
Nat Slaughter spent two years walking Central Park to make this central park map
davidrumsey.com/luna/servlet…
Aaron Taveras’s stunning trail maps of the Pacific Northwest
cartografix.co/
Daniel Huffman’s 3 ft. map of Michigan
somethingaboutmaps.com/Landf…
Carl Churchill’s pitch-perfect relief maps in Imhof style
flickr.com/photos/cchurchili…
Bill Marsh’s 30-year project to map Philadelphia
store.philamuseum.org/philad…
Eric Knight’s Nat Geo panoramas
ericknightmaps.com/panoramas
Marty Schnure’s wilderness maps
martyschnure.cargo.site/cart…
Margot Dale Carpenter’s landform maps for publishing
hartdalemaps.com/
Jamie Robertson’s trail maps of Big Sky country
cairncarto.com/product/publi…
Mike Hermann’s Pennsylvania trail maps
purplelizard.com/
Maddy Grubb’s Blender maps of mountains
maddygrubbmaps.github.io/Map…
John Tauranac learned Illustrator and walked every block in Manhattan to make his own guide maps
johntauranac.com/tauranac_s_…
Eleanor Lutz is a bio PhD and taught herself how to make all kinds of maps of earth, sky and everything in between
eleanorlutz.com/animated-sea…

18 Apr 2025

Someone needs to do handmade maps in the digital world. The same underlying data, chosen and arranged by human designers.
2
24
184
19,495
11 Apr 2025
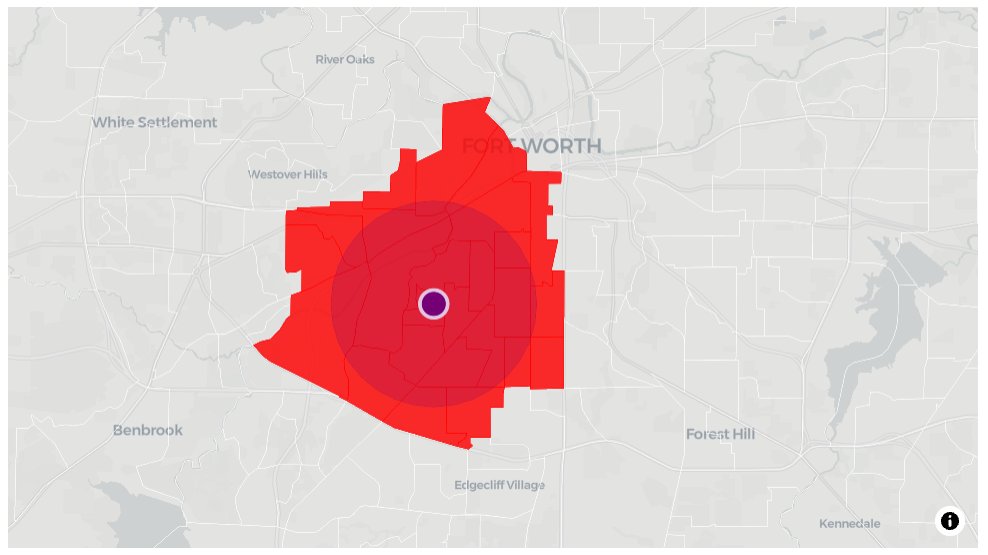
Users were directed to their nearest recommended location using the utility library @turfjs (distance and bearing) but we also used `queryRenderedFeatures` from Mapbox GL JS to determine if they were standing in a park or forest.
1
1
68