
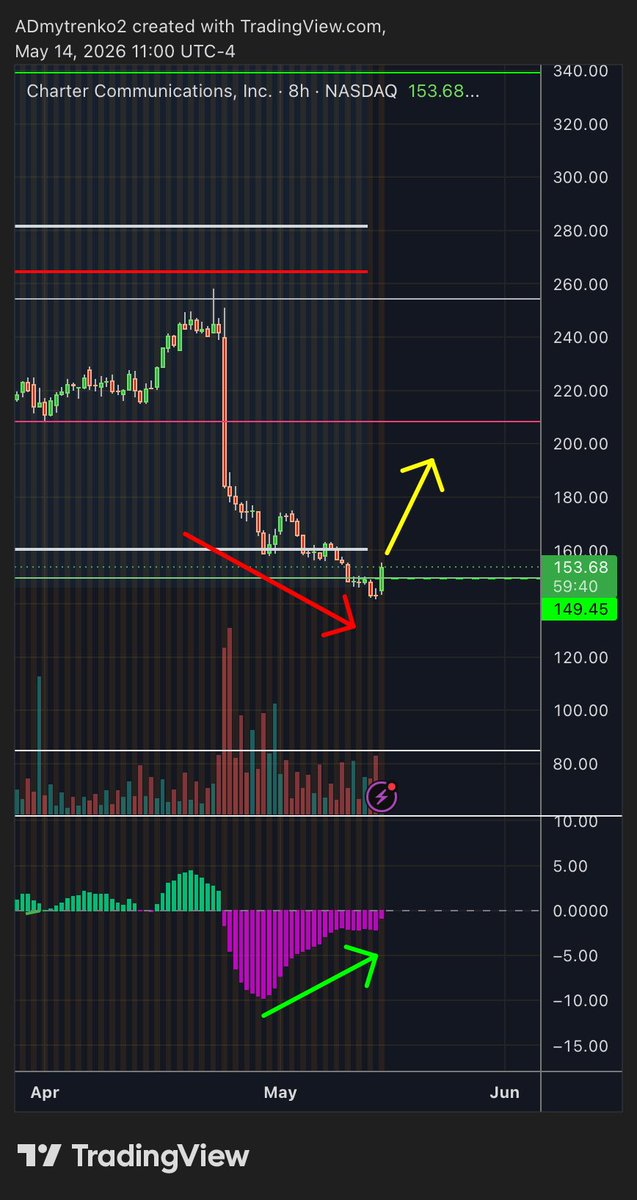
Potential 30% gain in $CHTR with target of approx $196. While price was going down, Delta Divergence was going closer to 0, showing downward force is weakening.
#stocks #TradingBots #TradingStrategy #daytrading #swingtrading #investing #trading #stockmarket #technicalindicators
1
1
3
215

If everyone reads charts correctly, why do only a few actually profit? 👀
Because real results come from understanding and applying technical indicators effectively.
Explore our blog to learn how to use them the right way 🔗 tinyurl.com/yfunh59k
#KoinBX #CryptoTrading #TechnicalIndicators #TradeSmart
4
54

MASTER THE MARKET WITH MACD PRECISION AND CONFIDENCE
The world of trading is full of noise, confusion, and emotional decisions, but one indicator has stood the test of time for its simplicity and effectiveness and that is the MACD indicator. Moving Average Convergence Divergence is not just a tool, it is a complete framework that helps traders understand momentum, trend direction, and potential reversals in a structured way.
At its core, MACD is built using moving averages, which means it reacts to price action rather than predicting it. This makes it reliable because it is based on what the market is actually doing rather than assumptions. It consists of three key elements which are the MACD line, the signal line, and the histogram. Together they create a powerful visual system that even beginners can learn quickly.
One of the most important concepts in MACD trading is the signal line crossover. This is often the first thing traders learn and for good reason. When the MACD line crosses above the signal line, it indicates increasing bullish momentum. This is where many traders consider entering a long position because buyers are starting to take control.
On the other hand, when the MACD line crosses below the signal line, it signals bearish momentum. This suggests that sellers are gaining strength and it may be a good opportunity to consider short positions. However, smart traders do not blindly follow every crossover. They look at the overall trend and market context before making decisions.
The beauty of signal line crossovers is their simplicity. Even on a quick glance, you can identify potential entries. But the real power comes when you combine this with patience. Waiting for confirmation such as strong candles or support and resistance alignment can significantly improve your accuracy.
Another powerful feature of the MACD indicator is divergence. This is where the indicator starts telling a different story than the price itself. When price makes a lower low but MACD makes a higher low, it indicates that selling pressure is weakening. This is called bullish divergence and it often appears before a strong upward move.
Similarly, when price makes a higher high but MACD makes a lower high, it shows that buying momentum is fading. This is known as bearish divergence and can be an early warning sign of a potential reversal. Divergence is one of the most valuable tools for traders because it gives insight into hidden market strength or weakness.
Understanding divergence requires observation and practice. It is not always perfect, but when it aligns with key levels like support or resistance, it becomes extremely powerful. Traders who master divergence often gain an edge because they can anticipate moves before the majority reacts.
The third key concept is the centerline crossover. This occurs when the MACD line crosses above or below the zero line. When it crosses above the centerline, it indicates that the shorter term moving average is now stronger than the longer term one, confirming an uptrend.
When the MACD line crosses below the centerline, it confirms a downtrend. This type of signal is slower compared to signal line crossovers, but it is more reliable for identifying strong trends. It helps traders stay in winning trades longer instead of exiting too early.
Combining all three concepts creates a complete trading system. Signal line crossovers help you identify entries. Divergence helps you spot reversals early. Centerline crossovers confirm the overall trend. When these three align, the probability of success increases significantly.
Another important aspect is discipline. Many traders fail not because their strategy is wrong, but because they lack consistency. MACD provides clear rules, but it is up to the trader to follow them without emotional interference. Fear and greed can easily destroy even the best setups.
Risk management is equally important. No indicator is perfect, including MACD. There will always be losing trades. The key is to keep losses small and let winners grow. Using stop losses and proper position sizing ensures long term survival in the market.
It is also important to avoid overtrading. Not every crossover or divergence needs to be traded. The best setups are those that align with the trend and occur at key market levels. Quality always beats quantity in trading.
Timeframe selection plays a big role as well. MACD works on all timeframes, but higher timeframes generally provide stronger and more reliable signals. Beginners should focus on clarity rather than speed.
Another advantage of MACD is its adaptability. It can be used in stocks, forex, crypto, and indices. This makes it a universal tool that traders across different markets can rely on.
The histogram is often overlooked but it provides valuable insight into momentum strength. Increasing histogram bars indicate strengthening momentum, while decreasing bars show weakening momentum. This helps traders gauge the strength behind a move.
Confidence in trading does not come from guessing, it comes from understanding. MACD helps build that understanding by showing the relationship between price and momentum in a visual way.
The more you observe MACD in real market conditions, the better you become at reading it. Over time, you will start recognizing patterns and behaviors that give you an advantage over others.
Trading is not about being right every time, it is about being consistent over time. MACD provides a structured approach that removes randomness and replaces it with logic and clarity.
CONCLUSION
The MACD indicator is not just a tool, it is a complete roadmap for understanding market behavior through momentum and trend. By mastering signal line crossovers, divergence, and centerline crossovers, traders can make more informed and confident decisions. Success in trading comes from discipline, patience, and consistency, and MACD helps build all three. When used correctly, it transforms confusion into clarity and turns uncertainty into opportunity.
x.com/@marketpulse247
#MACD #TradingStrategy #StockMarketIndia #TechnicalAnalysis #PriceAction #StockTrading #IntradayTrading #SwingTrading #MarketPulse247 #TradingTips #LearnTrading #StockMarketBasics #TradingEducation #MomentumTrading #Bullish #Bearish #ChartPatterns #Indicators #TradingMindset #FinancialFreedom #MarketAnalysis #TraderLife #TradingJourney #StockMarketLearning #InvestSmart #TradeSmart #CryptoTrading #ForexTrading #Nifty50 #BankNifty #MarketTrends #TradingSignals #TechnicalIndicators #StockTips #InvestingIndia #MoneyMaking #WealthCreation #TradingCommunity #BeginnersTrading #AdvancedTrading #TradingSkills #ProfitMaking #StockCharts #DailyTrading #TradeLikePro #MarketStrategy #TradingEdge #SmartMoney54

3
4
501

Apr 2
The Aroon Screening Capabilities and How To Use this Indicator in a Trading Strategy
The Aroon indicator is available on the stock charts and in the stock screener. You can use it to find consoli ...
chartmill.com/documentation/…
#ChartMill #stockscreener #TechnicalIndicators #Aroon

2
122

Mar 31
Indicator vs Oscillator — A Key Takeaway
A very common question in technical analysis is: What is the difference between an indicator and an oscillator?
In this short video, I break it down in the simplest way possible.
An oscillator is essentially a type of indicator that operates within a fixed range (banded) — meaning it has a defined ceiling and floor. A classic example is the Relative Strength Index (RSI), which moves between 0 and 100.
On the other hand, indicators like the MACD (Moving Average Convergence Divergence) are not banded — they can expand and contract freely with price, without any fixed limits.
What you’ll learn:
-Indicator vs Oscillator explained in simple terms
-Why RSI is an oscillator and MACD is not
-How oscillators naturally form frequent divergences
-Why MACD divergences are rarer but often stronger
-How to choose the right tool based on your trading approach
If you use indicators like RSI, MACD, Stochastic Oscillator, this distinction will help you read charts with much more clarity.
Trade well.
#Technicalanalysis #RSI #MACD #Technicalindicators
5
376

Mar 10
Indicator-based AI Algo Trading for Retail Traders
✅Build strategies using 19 indicators
✅ ATR, MACD, RSI, Bollinger Bands, VWAP & more
✅ Options Equity
✅ AI prompts = Instant algos
Sign up: utradealgos.com/auth/login
#AlgoTrading #TechnicalIndicators #AITrading
3
135

Overwhelmed by indicators on NinjaTrader? 📈
Here’s how to choose the right ones:
✅ Focus on what fits your strategy (trend, momentum, or volatility)
✅ Keep it simple—too many indicators = analysis paralysis
✅ Test, track, and tweak for consistent results
Make your charts work for you, not the other way around. 🔥
affordableindicators.com/art…
#NinjaTrader #TechnicalIndicators #TradingTips #TradeSmarter #MarketAnalysis #TradingStrategy #InvestorTools #ChartingMadeEasy #SmartTrading #TradingEfficiency
4
80
🎯 Choosing the right NinjaTrader indicators can transform your trading results.
From OHLC averages to MACD crossovers and RSI signals, this guide breaks down the most popular technical indicators, explains how they work, and helps you select the right ones for your trading style.
Learn how to choose indicators: affordableindicators.com/art…
#NinjaTrader #TechnicalIndicators #TradingStrategy #DayTrading
2
102

This indicator measures market strength and helps traders spot when momentum may fade.
It’s simple. Powerful. Used worldwide.
Can you name it? 👇
#Trading #TechnicalAnalysis #Aetram #tradewithaetram #technicalindicators #MomentumTrading
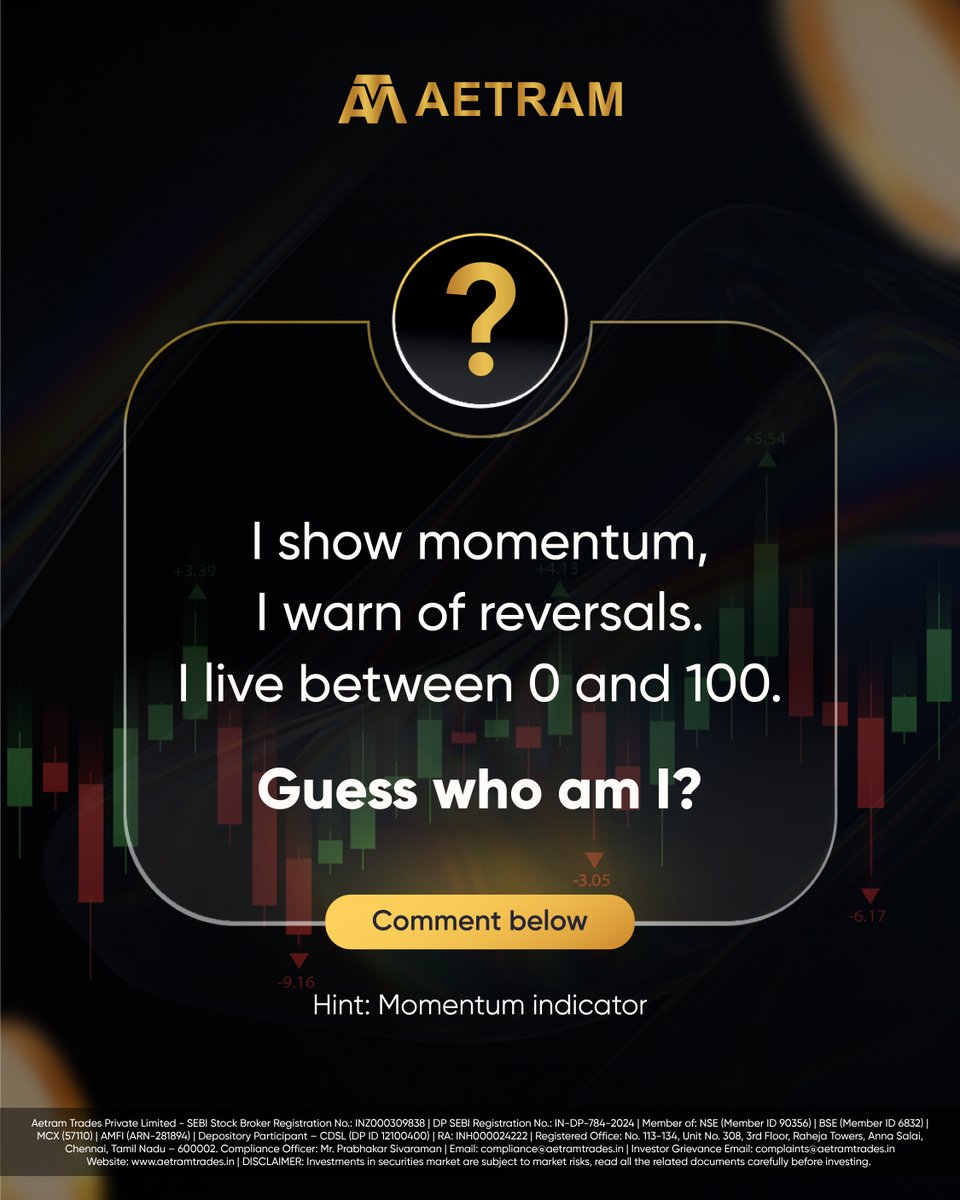
ALT Dark-themed trading graphic with candlestick charts in the background and a question prompt asking users to identify a momentum-based technical indicator commonly used by traders.
1
3
17

Why Technical Indicators Don’t Work the Way You Think | EA Trading Reality 1kpips.com/en/help/articles/… #ea #fx #forex #technicalindicators
2
13

28 Dec 2025
Ever wondered which of your stocks is the true leader? The key might be hiding in the Relative Strength line.
When a stock’s RS line hits a new high, it’s a sign it’s leading the market. And when the market is weak, a rising RS line shows the stock is outperforming.
Keep an eye on this—because a stock bucking the trend could be the one you want to hold.
Click Here: zurl.co/mXCKj
#RelativeStrength #StockLeader #RSLine #MarketOutperformance #StockBreakout #InvestmentSignals #StockAnalysis #TechnicalIndicators #MSI
1
16
440

28 Nov 2025
Built-in precision.
Over 80 technical indicators. MACD, RSI, Bollinger Bands, and more.
Right there when you need them.
ZeroPro. ZeroMobile. ZeroFree.
Start trading with the tools that keep you focused.
Open your account now👉Link in the bio.
#TradeZero #TechnicalIndicators #ZeroPro #ActiveTrading #TradingTools #FindYourEdge
1
225

18 Nov 2025
📊 Power Technical Indicators - Learn & Trade Smarter
🎥 Watch this insightful video by Mr. Mallinath Mulage to learn how to use technical indicators effectively in trading.
#technicalanalysis #technicalindicators #stockmarket #daytrading #marketanalysis #thesafetraderacademy
1
1
27

26 Sep 2025
𝐀𝐊𝐃 𝐃𝐚𝐢𝐥𝐲 𝐓𝐞𝐜𝐡𝐧𝐢𝐜𝐚𝐥
𝐊𝐒𝐄-𝟏𝟎𝟎: 𝐓𝐫𝐚𝐝𝐢𝐧𝐠 𝐚𝐭 𝐚𝐥𝐥 𝐭𝐢𝐦𝐞 𝐡𝐢𝐠𝐡
The index opened on a steady note and maintained its bullish momentum throughout the previous session. It touched an intraday peak of 1,301 points before closing with a strong gain of 1,043 points at 159,280. Investor participation eased, with trading volumes falling 14% from the prior session. The daily Parabolic SAR is positioned below the current Index level, while the MACD is reducing its bearish momentum and moving closer to the signal line. Meanwhile, the RSI (Relative Strength Index) is bullish, showing a reading of 77.
Full Report
research.akdsl.com/638944781…
#KSE100 #PSX #StockMarketTechnical #Trading #TechnicalAnalysis #StockMarket #InvestSmart #MarketTrends #ChartAnalysis #TechnicalIndicators #DayTrading #InvestmentStrategy #FinancialLiteracy #StockTrading #MarketInsights #TradeSmart #Investing101 #StockCharts #TraderEducation #MarketAnalysis #BullishTrends #BearMarket

10
783
24 Sep 2025
𝐀𝐊𝐃 𝐃𝐚𝐢𝐥𝐲 𝐓𝐞𝐜𝐡𝐧𝐢𝐜𝐚𝐥 - 𝐒𝐞𝐩 𝟐𝟒, 𝟐𝟎𝟐𝟓
𝐊𝐒𝐄-𝟏𝟎𝟎: 𝟓-𝐒𝐌𝐀 𝐭𝐞𝐬𝐭𝐞𝐝; 𝐮𝐩𝐬𝐢𝐝𝐞 𝐥𝐢𝐤𝐞𝐥𝐲
Market View — Technical
The index began on stable ground but traded with volatility, hitting an intraday high of 1,277 points and a low of 138 points, before closing with a gain of 390 points at 157,945. Investor activity softened as trading volumes declined 7% compared to the prior session. The KSE100 ended 22.7% below the upper Bollinger Band, which is currently 20.36% wider than usual. Over the last 10 sessions, the index recorded 4 positive closings and 6 negative closings, resulting in a net of two negative closings. Volume indicators suggest moderate inflows, pointing to a mildly bullish view.
Full Report
research.akdsl.com/638943033…
#KSE100 #PSX
#StockMarketTechnical #Trading #TechnicalAnalysis #StockMarket #InvestSmart #MarketTrends #ChartAnalysis #TechnicalIndicators #DayTrading #InvestmentStrategy #FinancialLiteracy #StockTrading #MarketInsights #TradeSmart #Investing101 #StockCharts #TraderEducation #MarketAnalysis #BullishTrends #BearMarket

3
576

1 Aug 2025
𝐒𝐨𝐥𝐚𝐧𝐚 𝐍𝐞𝐰𝐬 𝐓𝐨𝐝𝐚𝐲: 𝐒𝐨𝐥𝐚𝐧𝐚 𝐚𝐭 𝐚 𝐂𝐫𝐢𝐭𝐢𝐜𝐚𝐥 𝐒𝐮𝐩𝐩𝐨𝐫𝐭: 𝐂𝐚𝐧 𝐁𝐮𝐥𝐥𝐬 𝐃𝐞𝐟𝐞𝐧𝐝 𝐓𝐡𝐢𝐬 𝐊𝐞𝐲 𝐋𝐞𝐯𝐞𝐥?
#Solana #CryptoSupport #50DayEMA #CryptoMarket #SolanaAnalysis #TechnicalIndicators #AI #AINews #AnalyticsInsight #AnalyticsInsightMagazine
Read More👇
zurl.co/GKzxD
2
78

2 Jul 2025
iya, tapi fetching API Binance (websocket). khusus trade di Binance, volumenya bukan global, hanya Binance. library analisa pake technicalindicators dan trading-signals grafik pake lightweight-charts.
2
2
840

30 Jun 2025
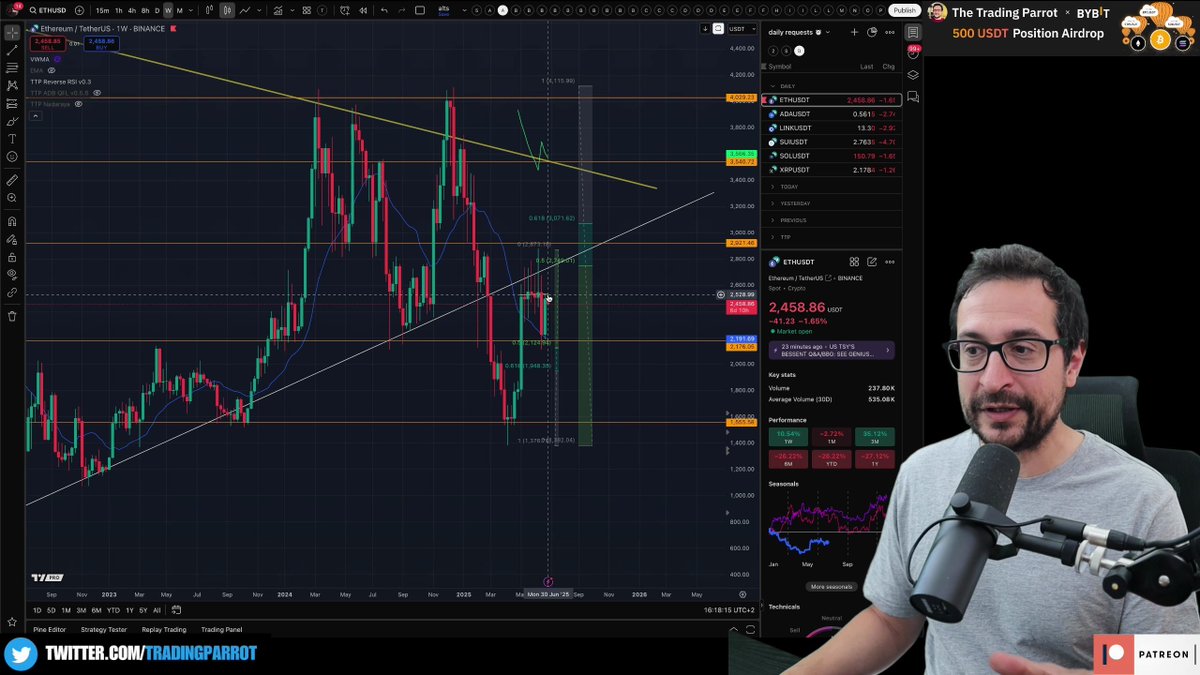
$ETH ALERT: Multiple indicators screaming the same thing - $2,500 is the battlefield!
The Trading Parrot shows why breaking this level changes EVERYTHING for Ethereum's next move.
Critical analysis here in today's full clip
youtu.be/fUOOFDzcB4c?t=610
#ETHAnalysis #CryptoResistance #TechnicalIndicators #Ethereum #TTP
6
630

12 Jun 2025
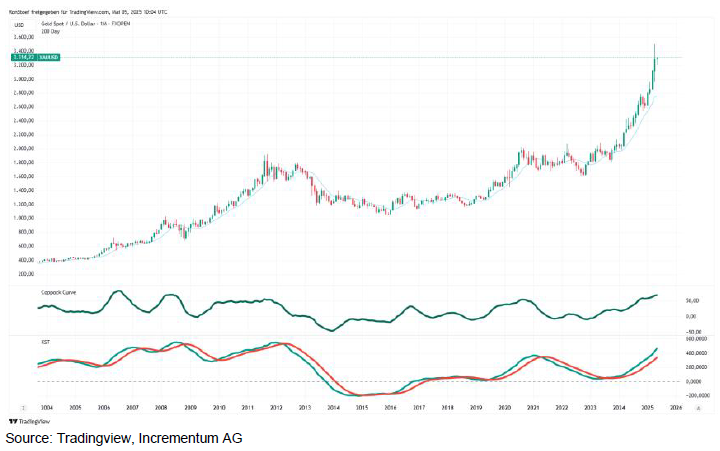
4/10 🔀 Momentum divergence ahead?
🔜 RSI and MACD have diverged from price on daily and weekly timeframes—often a precursor to retracements.
Gold’s strength is real, but so is technical fatigue. #TechnicalIndicators
1
5
248

12 Jun 2025
How to Identify Bull and Bear Trends Like a Pro? Master 3 Key Signals at Once!
Trading is risky to your capital; the provided information is not financial advice.
#PT_Fintech #Forex #RSI #KDIndicator #Envelopes #Stochastic #TradingStrategy #TechnicalIndicators
1
2
54