
Joined February 2009
- Tweets 27,065
- Following 1,694
- Followers 16,710
- Likes 25,579
1,176 Photos and videos


jaynemesis retweeted

Jun 15
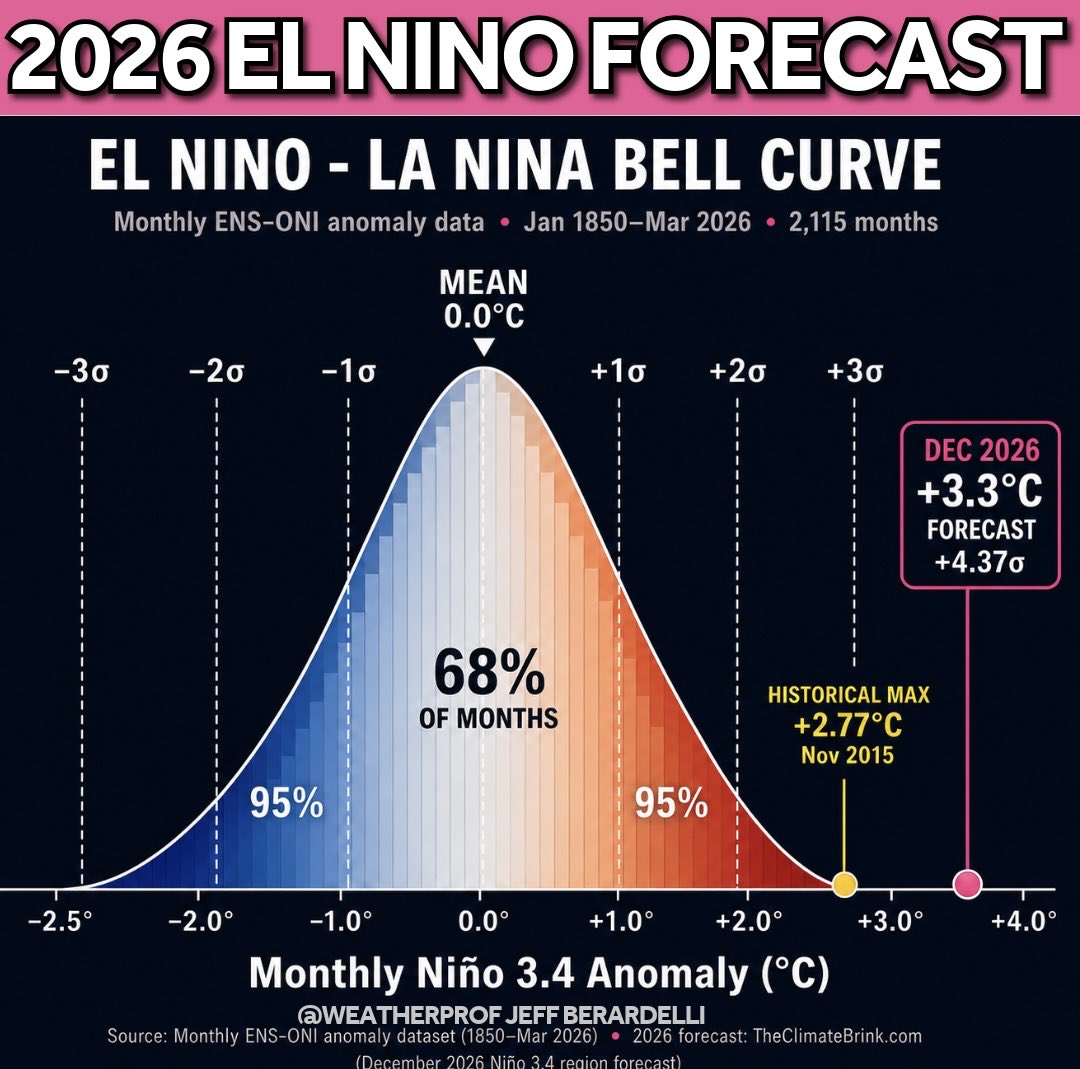
4.4 standard deviations from the mean?!
To put into perspective how strong this El Niño has the “potential” to be, I plotted it on the Bell Curve/ distribution of all El Nino, La Niña, & neutral months since 1850 (over 2K). The dynamical model ensemble median forecast peak anomaly is 3.3°C in December 2026. Comparing against all Nino (3.4 region) values yields a value of 4.4 sigma for this event, plotted outside the extreme right tail, next to the current record of 2.8C in 2015. Keep in mind this is not the relative index, so it does not account for global warming, and the fact that higher SST anoms are easier to achieve now due to the higher starting baseline. #elnino 1/ 🧵
12
83
249
17,538
jaynemesis retweeted

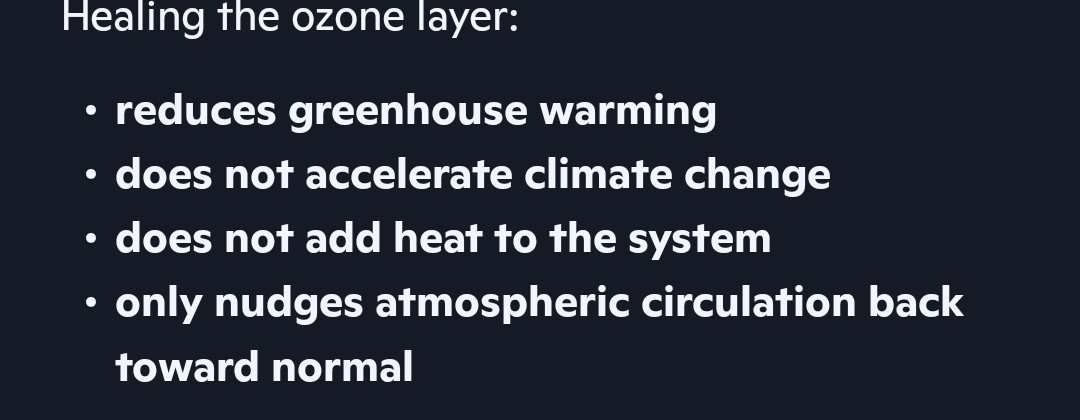
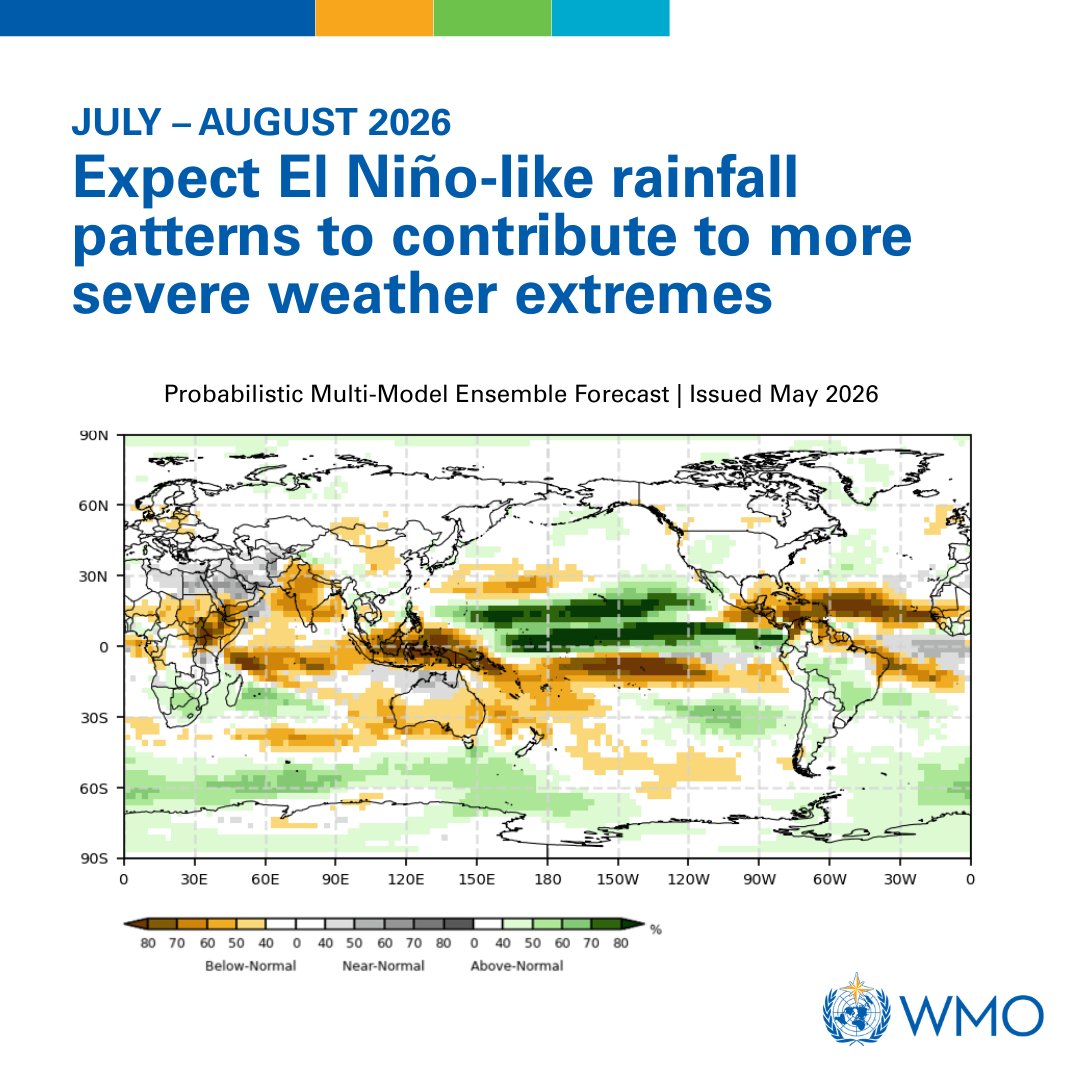
Prepare for hotter-than-normal temperatures across nearly all parts of the globe
Expect El Niño-like rainfall patterns to contribute to more severe weather extremes
@WMO

Jun 15

4.4 standard deviations from the mean?!
To put into perspective how strong this El Niño has the “potential” to be, I plotted it on the Bell Curve/ distribution of all El Nino, La Niña, & neutral months since 1850 (over 2K). The dynamical model ensemble median forecast peak anomaly is 3.3°C in December 2026. Comparing against all Nino (3.4 region) values yields a value of 4.4 sigma for this event, plotted outside the extreme right tail, next to the current record of 2.8C in 2015. Keep in mind this is not the relative index, so it does not account for global warming, and the fact that higher SST anoms are easier to achieve now due to the higher starting baseline. #elnino 1/ 🧵
7
45
115
5,438
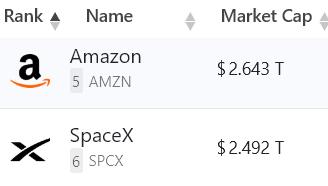
SpaceX is valued as if it will grow at around 7.5x the speed Nvidia will... based on revenue..
We can't base it on profit because there is none.
1
3
256


Jun 15
Honestly... I think this is a good move.
Social media is immensely damaging.
Jun 15

🚨 SUMMARY: The UK's social media ban for children from early 2027:
- "User-to-user" apps where people create, share and interact with content (e.g. TikTok, Instagram, Snapchat, YouTube, X, Facebook) will be banned for under-16s
- WhatsApp, Signal and YouTube Kids will be exempt
- Under-16s will also be banned from livestreaming, messaging strangers on gaming apps like Discord and using disappearing messages
- 16 and 17 year olds will face nightly social media curfews and limits on infinite scrolling with more details next month
- AI "romantic companion" chatbots will be banned for under-18s
- Adults can still access social media through age checks like facial recognition, digital IDs, passports and credit cards
157
3
22
10,450
Yep, it sucks.. it's hacking.. same thing happens with NHS records, or with government gateways, or with porn websites.. with banks..
I'd prefer we force social media websites to get content properly, but unfortunately it's not going to happen is it..
1
192
Do you at least accept that kids going on twitter and following bot and weirdos with all kinds of insane agendas, from financial scams to pedophile rings, to indoctrination into fringe political ideologies is not a good thing?
1
152
So many Americans in my timeline who are really angry kids in the UK can't follow them on social media..
Kinda weird.
4
17
1,040
jaynemesis retweeted

Jun 15
218
375
5,517
1,420,948
Jun 12
Oof, F1 is a bit of a shambles right now.. As everyone expected, the measurements were wrong.. Gasly gets his P3 back - great, but what about all the other penalties given during the race that completely changed the outcome?

BREAKING: Pierre Gasly has been reinstated into P3 for the Monaco Grand Prix
The Stewards have rescinded the two five-second penalties imposed on Pierre Gasly during the race for speeding in the pit lane
#F1

1
1
671
Jun 12
New eToro post about this in the works.. it's difficult to write about it when things are changing so quickly.

Just in: El Nino forms and expected to strengthen, say @NOAA forecasters
News release images: noaa.gov/news-release/el-nin…
#ElNino #ENSO @nws

ALT Satellite imagery showing the difference from average sea surface temperatures at the equator in the tropical Pacific Ocean (depicted using various shades of red and orange for warmth) during the first week of June 2026, as compared with the baseline used by NOAA’s Coral Reef Watch. (Image credit: NOAA Satellites )
4
707
jaynemesis retweeted

Jun 9
The average Claude Mythos user be like

Introducing Claude Fable 5: a Mythos-class model that we’ve made safe for general use.
Its capabilities exceed those of any model we’ve ever made generally available.
85
85
1,514
370,593

jaynemesis retweeted

🌊🌡️The progression here is crazy. This was never a “meh” forecast, but the escalation from February to June is something else entirely. The ECMWF plume is now deep into record-breaking Super El Niño territory.
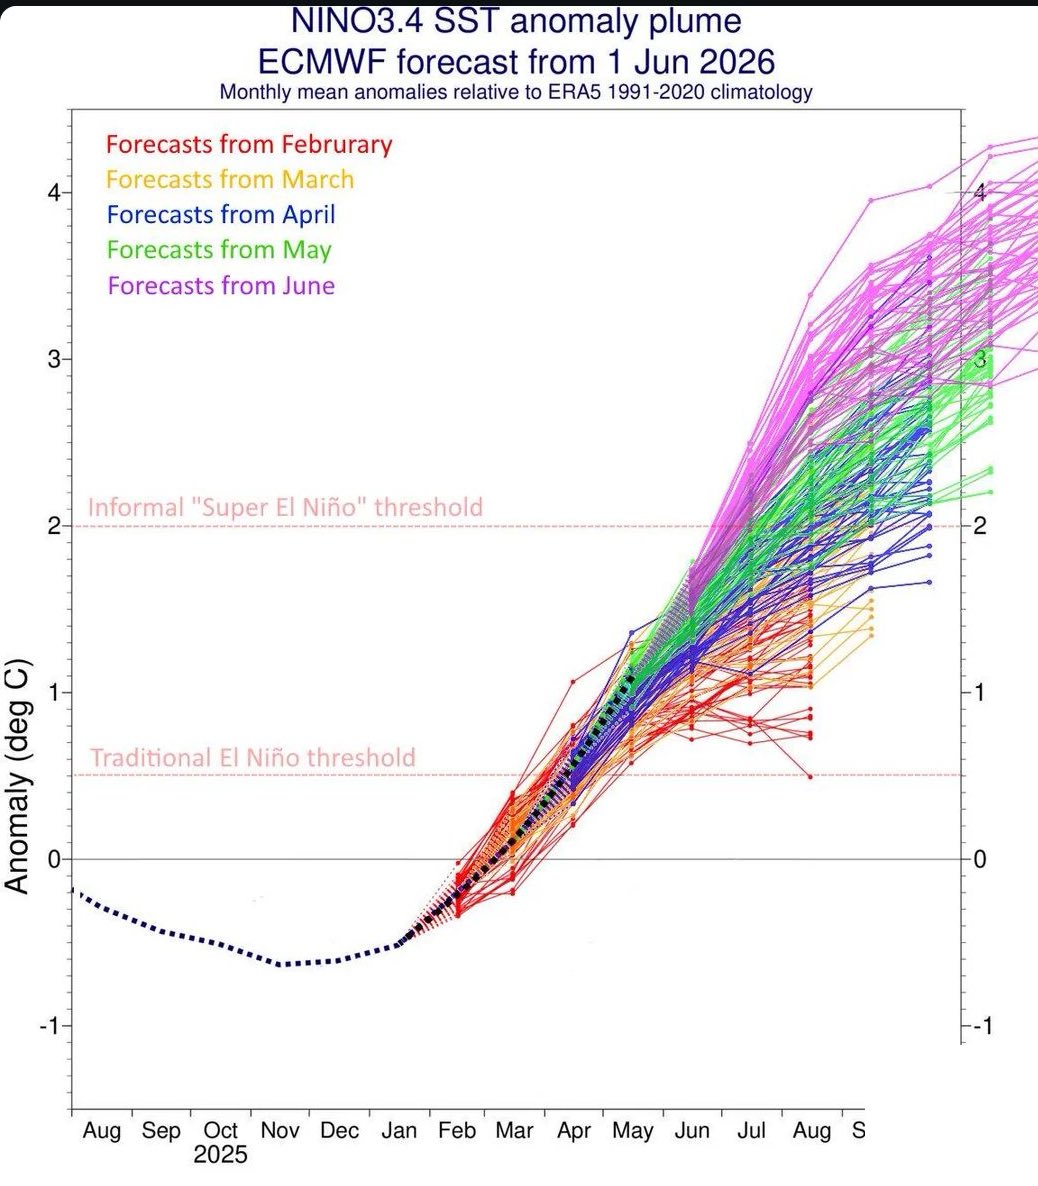
8
42
140
22,053
jaynemesis retweeted

Jun 4
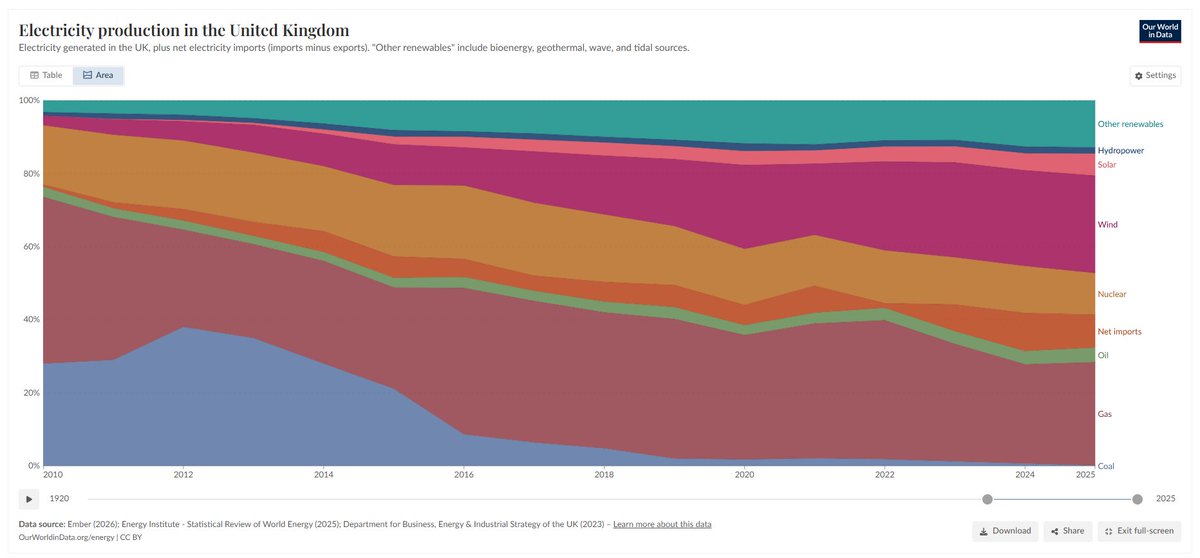
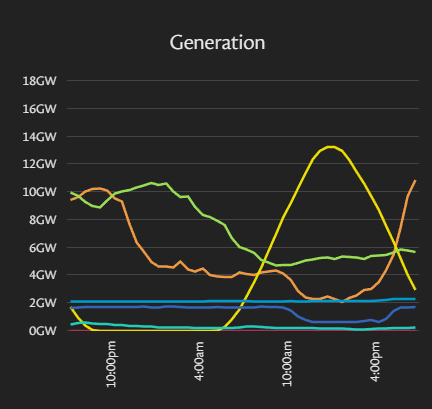
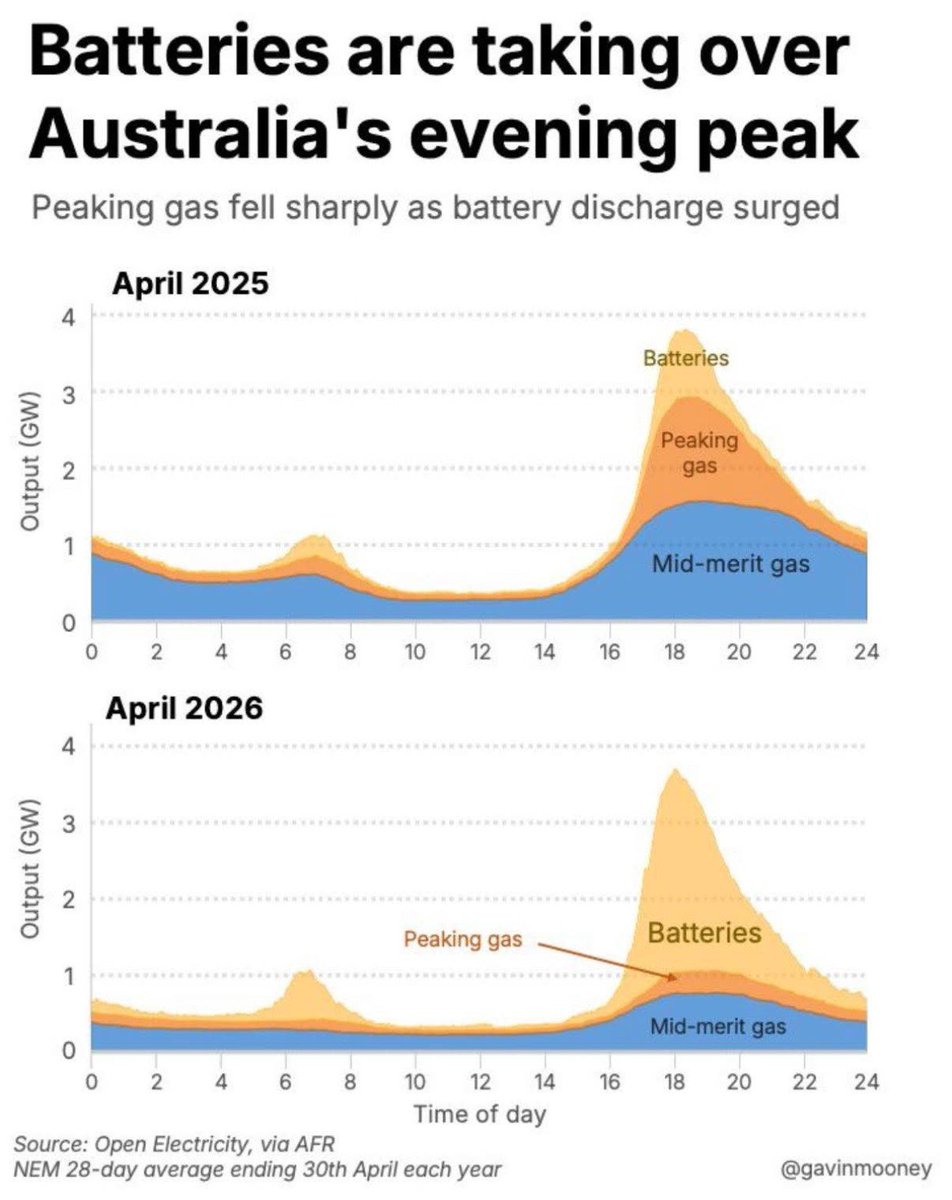
Gas spent 20 years owning the evening peak. Batteries took a year to crash the party.
That's disruption. Not gradual, but a rapid shift in who supplies grid's most valuable hours.
The battle was never about total generation. It was about the peak & batteries are winning it.
81
458
1,347
49,857
jaynemesis retweeted

Jun 4
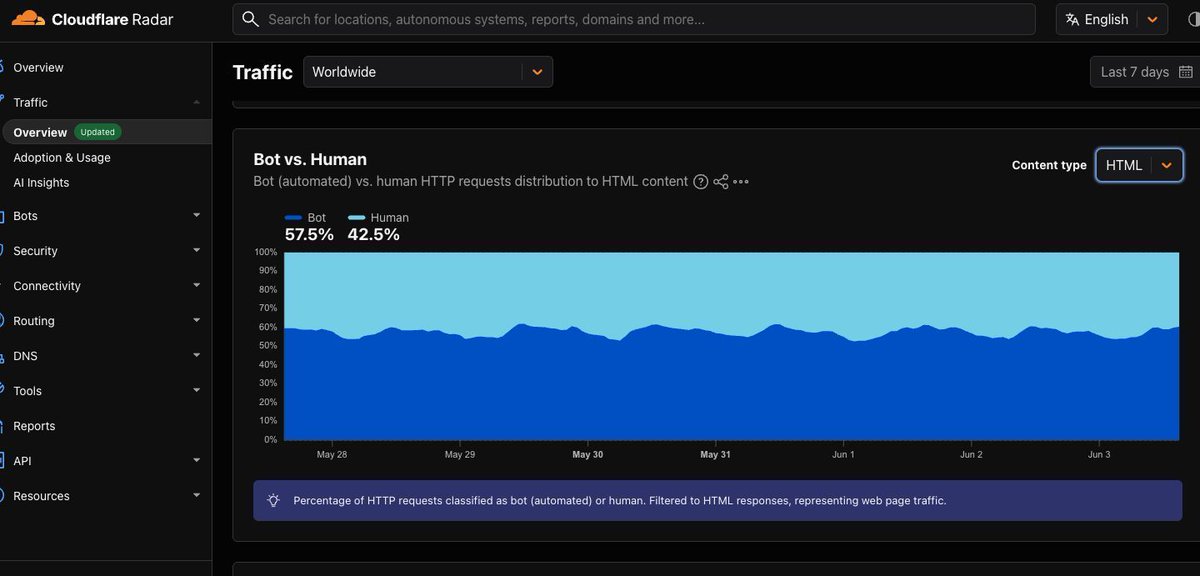
BREAKING NEWS: according to CloudFlare Radar Data, Agentic traffic has SURPASSED human traffic across the worldwide internet for HTML webpages.
83
362
2,268
360,076
Jun 4
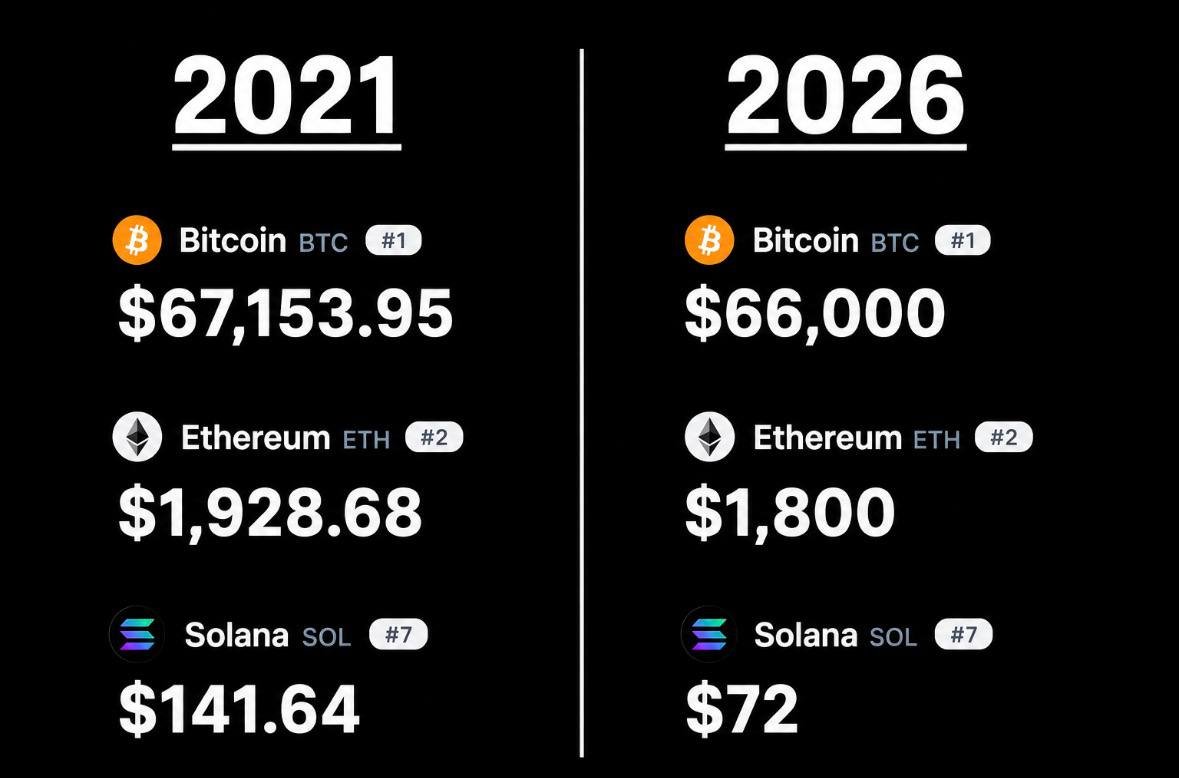
It was around 5 years ago I started turning very bearish on crypto for the long term.
I missed out on the really to 100k, but at the time I argued tech stocks offered much better risk/reward ratios and much higher potential upside. I was right, but early.
I have no regrets.

1
10
1,568
jaynemesis retweeted

Jun 3
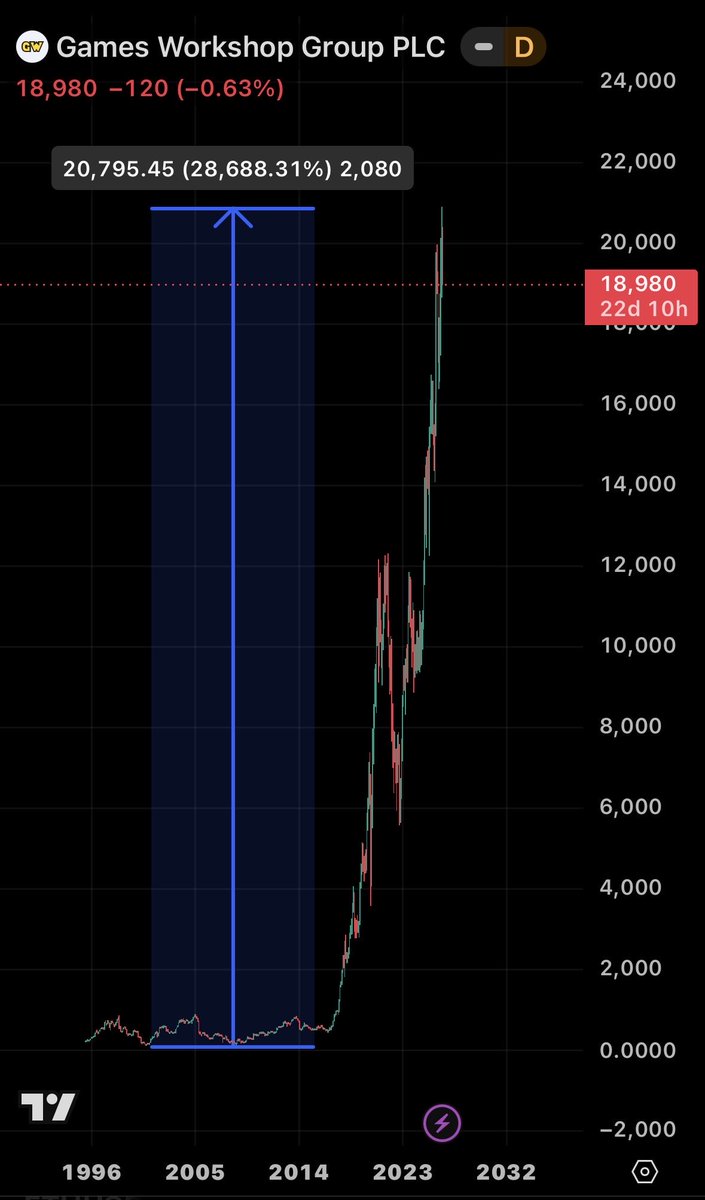
This is what investing is like in 2026

75
408
4,908
262,121
Jun 2
My latest @eToro post is up!
This time, I talk Japanese Stocks!
Give it a read and tell me what you think.
etoro.tw/4vnmxZF
5
675
jaynemesis retweeted

Jun 1
🚨 S&P 500 MAX DRAWDOWN IN EVERY MIDTERM ELECTION YEAR:
1962: -28.0%
1966: -22.2%
1970: -36.1%
1974: -48.2%
1978: -14.1%
1982: -27.1%
1986: -9.4%
1990: -19.9%
1994: -8.9%
1998: -19.3%
2002: -33.8%
2006: -7.7%
2010: -16.0%
2014: -7.4%
2018: -10.2%
2022: -25.4%
NOT A SINGLE POSITIVE RETURN IN 60 YEARS
2026 WON'T BE DIFFERENT
128
117
532
524,874
