
2 Jun 2025
Calling all aspiring data professionals!
Are you a beginner or mid-level data analyst, or looking to level up as a machine learning professional?
Don’t miss our free, exclusive workshop on Python and SQL for Data Analytics and Machine Learning.
Date: Wednesday, June 4th
Time: 5PM WAT
Whether you’re just getting started or you want to up-skill, come learn sharpen your skills, learn practical techniques and real insights to move you forward in your career.
Register now via: bit.ly/MasteringPythonAndSQL.
#DataSkills #LearnPython #SQLForData #Tech4DevWorkshops #MachineLearning #DigitalFuture
1
6
25
2,193

18 Nov 2024
You must understand which tool is good for which task as a data analyst.
This will allow you to deliver projects on time, ensuring optimal quality. Switching between tools according to tasks becomes easier once you get enough experience with each tool.
𝗟𝗲𝘁 𝗺𝗲 𝗴𝗶𝘃𝗲 𝘆𝗼𝘂 𝗮𝗻 𝗲𝘅𝗮𝗺𝗽𝗹𝗲:
• You have a large dataset to clean, preprocess, and transform. SQL is the best choice here.
• You may want to summarize data, you can do that in SQL using the "Pivot" command (in some RDBMS like Oracle, or SQL Server). If you don't know how to do that, you can summarize it in Excel very easily using pivot tables.
• If you want to perform EDA, I will again recommend SQL because it is great for that.
• Now, if you want to visualize data, you may use Power BI, Excel, Tableau, or Python according to the needs of the client or company you are working for.
• If you want to create automated data analysis scripts with visuals, then Python is the best choice.
Again, I am not saying that you cannot perform certain tasks with certain tools. I am just saying that these are the tools that I feel are optimal according to tasks.
Also, in my experience as a data analyst working with worldwide start-ups and clients, especially from the US, and UK, this is how I use these tools for data analytics tasks.
Enjoy. Follow for more!
#DataAnalytics #DataAnalyst #DataTools #AnalyticsBestPractices #SQLForData #PythonForData #PowerBI #ExcelTips #DataVisualization #EDA #PivotTables #AnalyticsSkills #DataInsights #USDataAnalyst #UKDataAnalyst #EuropeDataAnalyst #GlobalDataCareers #AnalyticsCommunity #HiringDataAnalysts #DataJobs #AnalyticsEfficiency #DataScienceTools #BusinessAnalysis #DataCareers #DataStrategy

2
30
6 Nov 2024
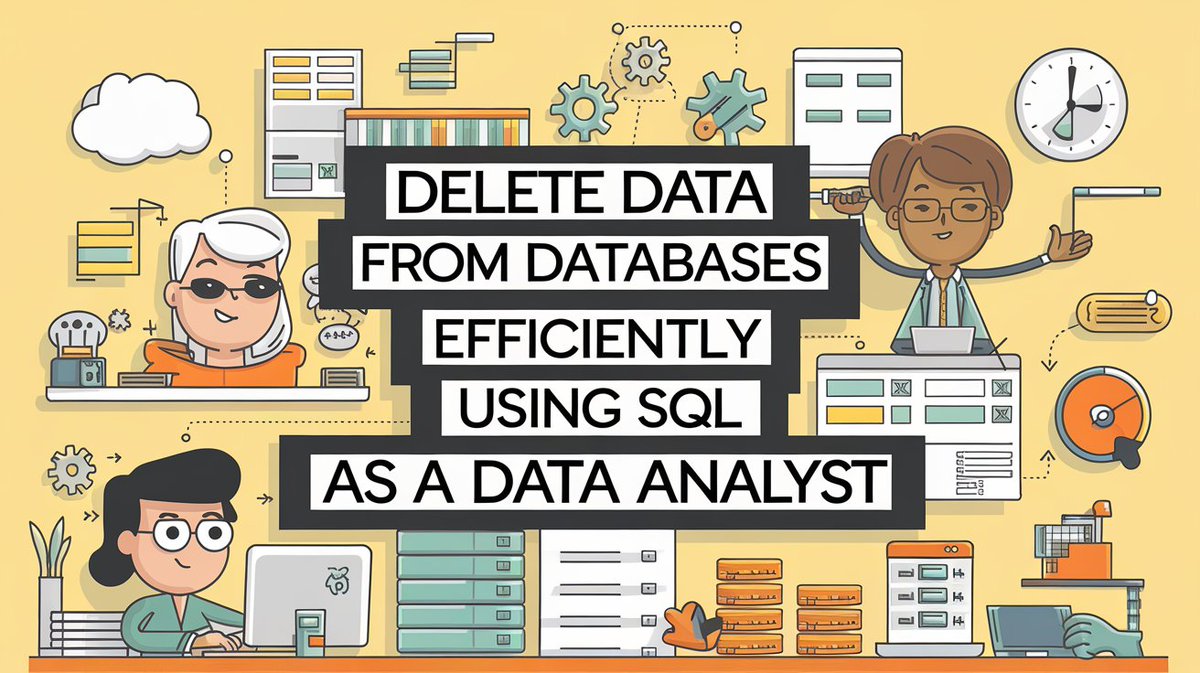
Working with SQL as a data analyst is so fun and I really love it.
It is also very important to learn SQL if you want to work as a data analyst.
While working with SQL as a data analyst, a lot of times, we need to delete rows, columns, views, and other objects as well.
Today, let's discuss how you can delete objects from a database using SQL keywords.
𝗗𝗶𝗳𝗳𝗲𝗿𝗲𝗻𝘁 𝗸𝗲𝘆𝘄𝗼𝗿𝗱𝘀/𝗰𝗼𝗺𝗺𝗮𝗻𝗱𝘀 𝘁𝗼 𝗱𝗲𝗹𝗲𝘁𝗲 𝗿𝗼𝘄𝘀 𝗮𝗻𝗱 𝗼𝘁𝗵𝗲𝗿 𝗼𝗯𝗷𝗲𝗰𝘁𝘀 𝗳𝗿𝗼𝗺 𝗮 𝗱𝗮𝘁𝗮𝗯𝗮𝘀𝗲 𝗶𝗻𝗰𝗹𝘂𝗱𝗲:
1. 𝗗𝗘𝗟𝗘𝗧𝗘
2. 𝗧𝗥𝗨𝗡𝗖𝗔𝗧𝗘
3. 𝗗𝗥𝗢𝗣
𝗟𝗲𝘁'𝘀 𝗱𝗶𝘀𝗰𝘂𝘀𝘀 𝗮𝗯𝗼𝘂𝘁 𝘁𝗵𝗲𝗺 𝗶𝗻 𝗮 𝗯𝗶𝘁 𝗱𝗲𝘁𝗮𝗶𝗹:
• 𝗗𝗘𝗟𝗘𝗧𝗘: It is used to delete rows from a table. If a WHERE clause is not provided in DELETE statements then it deletes all the rows from the table. Also, it doesn't free up the space occupied by the table.
𝗘𝘅𝗮𝗺𝗽𝗹𝗲:
DELETE FROM employees
WHERE fired_employee = 'Yes'
• 𝗧𝗥𝗨𝗡𝗖𝗔𝗧𝗘: It deletes all the rows from the table. It also clears the space that a table occupies. It is faster than DELETE. Also, in some databases, it cannot be rolled back unless it is used in a transaction.
𝗘𝘅𝗮𝗺𝗽𝗹𝗲:
TRUNCATE TABLE old_employees
• 𝗗𝗥𝗢𝗣: It is used for the deletion/removal of a database object. This command deletes all the rows present in the table and removes the complete table structure as well. It can also be used to delete databases
𝗘𝘅𝗮𝗺𝗽𝗹𝗲:
DROP DATABASE marketing
So, these are the keywords/commands that you can use to delete rows and other objects from the database as a data analyst.
Enjoy. Follow for more!
#DataAnalysis #SQLTips #SQLCommands #DatabaseManagement #DataAnalyst #SQLForData #DataCleaning #SQLSkills #DataScience #DataAnalystLife #TechTips #SQL #DataJobsUSA #SQLUSA #AnalyticsCareersUSA #DataAnalystUK #SQLUK #AnalyticsUK #DataAnalystEurope #SQLEurope #AnalyticsEurope #GlobalDataJobs #SQLWorldwide #DataScienceGlobal #AnalyticsCareersGlobal
1
2
37
31 Oct 2024
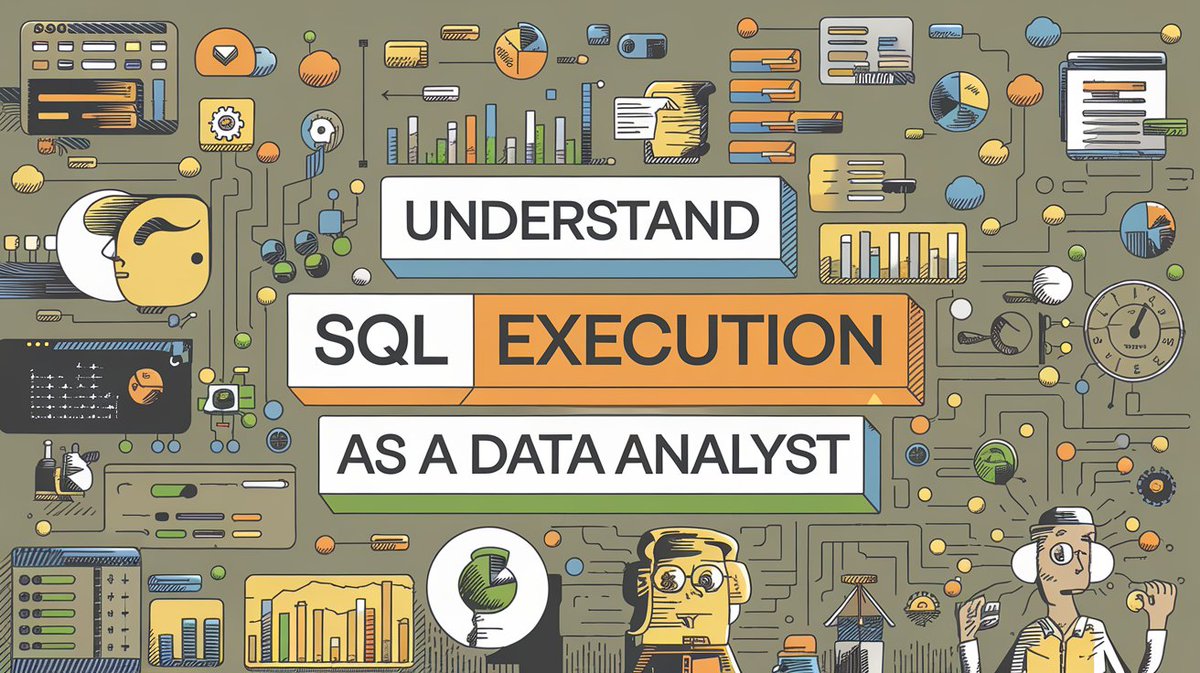
Data Analysts perform a lot of tasks with SQL such as data cleaning, data pre-processing, data transformation, EDA, and a lot more, improving database performance using partitioning, indexing, and more.
Let's discuss SQL execution in this thread!
#SQL #DataAnalytics #DataAnalyst #SQLTips #DataScience #DataAnalysis #DatabaseManagement #SQLQueries #TechCareers #AnalyticsJobs #DataJobs #SQLForData #SQLCommunity #DataAnalystJobs #HiringDataAnalysts #AnalyticsUK #AnalyticsUSA #DataEurope #GlobalDataCareers #SQLForBeginners #DataScienceUK #DataScienceUS #TechCareersEurope #DataCareers #SQLExecution #DataScienceEurope #SQLInsights #AnalyticsWorld #USDataAnalytics #UKDataAnalytics #EuropeDataAnalytics #GlobalDataInsights #DataScienceUK #DataScienceUSA #DataScienceEurope #AnalyticsGermany #DataAnalyticsFrance #DataJobsSpain #DataAnalystNetherlands #GlobalAnalyticsJobs #AnalyticsItaly #EUDataAnalyst #WorldwideDataCommunity #DataAnalyticsSweden #DataJobsEurope #GlobalTechCareers #AnalyticsIreland #UKAnalyticsJobs #EuropeanDataCommunity
1
4
39