
Jun 12
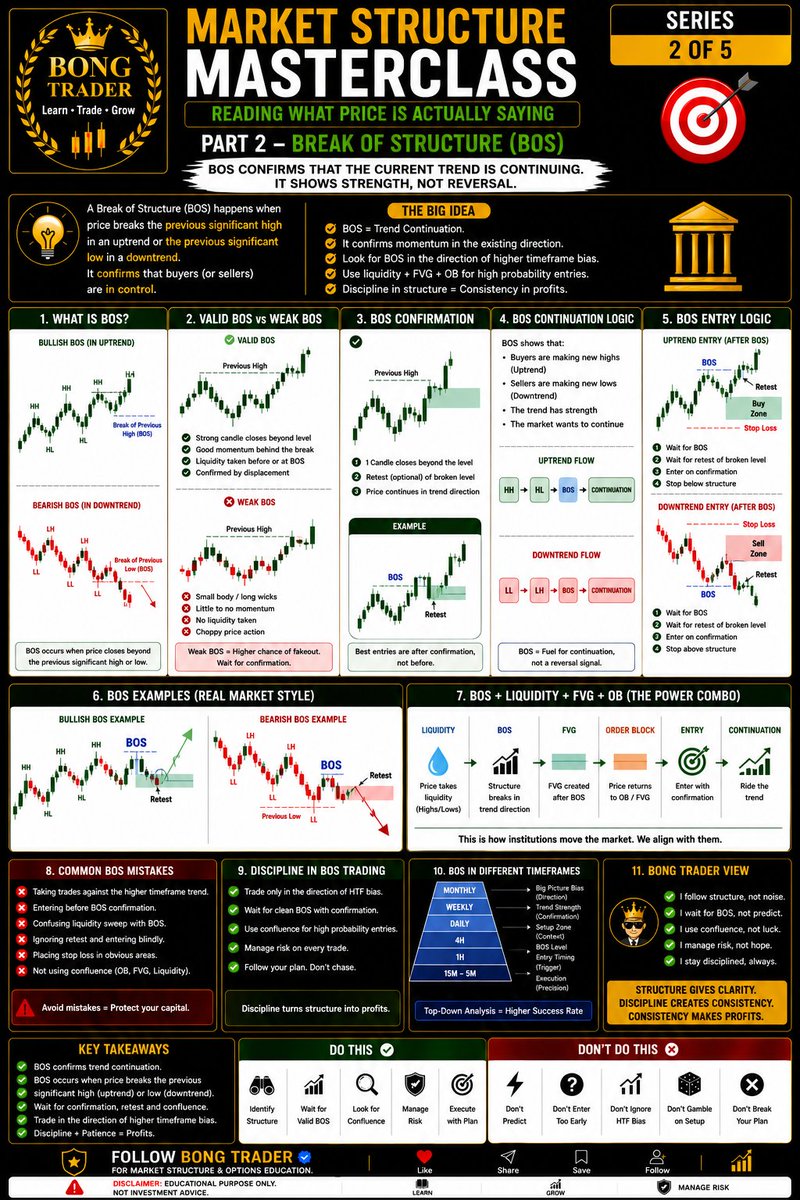
Market Structure Masterclass | Part 2 | Break of Structure (BOS) Explained
#MarketStructure #BOS #BreakOfStructure #PriceAction #TradingEducation #TechnicalAnalysis #SmartMoney #OptionsTrading #StockMarket #BongTrader
1
10

Jun 9
MASTER THOSE ENTRIES
Mastering FVG Order Block Fibonacci gives traders a powerful framework for identifying high-probability setups. First, wait for a liquidity sweep and a clear break of structure.
#ICT #SMC #FVG #OrderBlock #Fibonacci #LiquiditySweep #BreakOfStructure


2
3
218

Jun 7
MASTER THOSE ENTRIES
Mastering FVG Order Block Fibonacci gives traders a powerful framework for identifying high-probability setups. First, wait for a liquidity sweep and a clear break of structure. Then look for a strong Order Block that creates a Fair Value Gap (FVG). Finally, use the Fibonacci 0.71 retracement level for precise entries. When all three align, you have an A setup with strong confluence and better risk-to-reward opportunities.
#ICT #SMC #FVG #OrderBlock #Fibonacci #LiquiditySweep #BreakOfStructure #MarketStructure #PriceAction #ForexTrading #TradingSetup #RiskManagement #SmartMoneyConcepts #DayTrading #TradingEducation


26
129
5,338
Jun 4
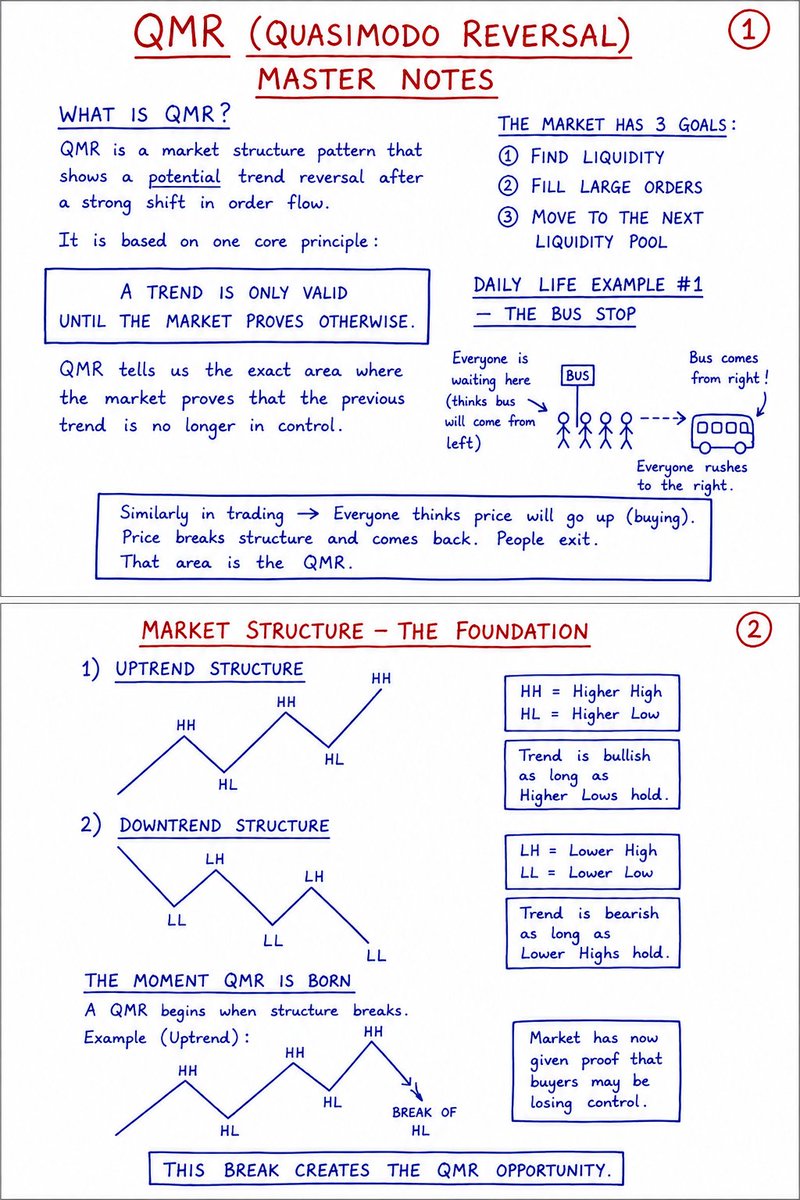
QMR (Quasimodo Reversal)
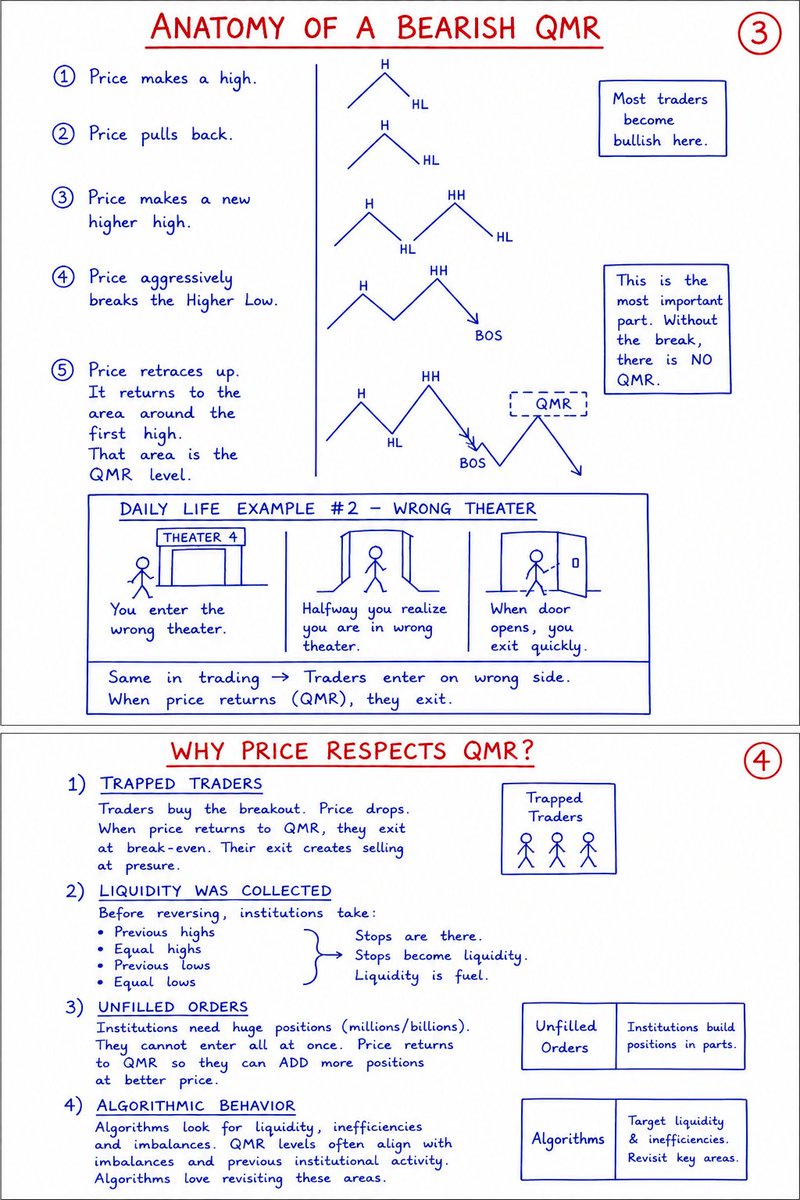
Anatomy of Bearish QMR
Price makes High → Pullback → Higher High
Then breaks Higher Low (BOS)
Market shows buyers losing control
Price retraces to QMR zone (first high area)
Entry comes from that return zone
Simple Idea
Structure break = Start of reversal
Return to level = Trading opportunity
Daily Life Concept
Enter wrong place → realize mistake → exit quickly
Same in trading → trapped traders exit at QMR
Why Price Respects QMR
1. Trapped Traders
Buy breakout → price drops
Exit at break-even → creates selling pressure
2. Liquidity Collection
Stops at highs/lows = liquidity
Market grabs liquidity before reversing
3. Unfilled Orders
Big players enter in parts
Price returns to fill more positions
4. Algorithmic Behavior
Algorithms target liquidity & imbalances
QMR aligns with these key zones
Liquidity → Break → Return → Move
#QMR #SmartMoneyConcepts #Liquidity #MarketStructure #BreakOfStructure #ForexTrading #PriceAction #TradingStrategy #ICT #OrderFlow #TradingEdge
4
28
1,260

Jun 4
CLEAR SETUP ( FULL EXPLANATION 📝)
FOLLOW - @tradewithyou7
#SMCEntryModel
#BreakOfStructure
#FairValueGapTrading
#CHOCHConcept
#forextradingeducation
5
9
404

📌 Full Video: youtu.be/sqQldGP2K80
The biggest trading mistake isn't picking the wrong stock.
It's entering at the wrong place.
Most traders wait for a stock to become obvious.
By then, the move is already mature.
Risk is high.
Reward is shrinking.
And smart money is often doing the exact opposite of what retail traders are doing.
So where do institutions actually enter?
Not at the top.
Not after a breakout everyone can see.
They enter during pullbacks.
They enter after structure shifts.
They enter during accumulation when nobody is paying attention.
This is where market structure changes everything.
In this video, I break down 3 powerful market structure entry models used across stocks, Nifty, Bank Nifty, ETFs and global markets.
1️⃣ Pullback Entry
Instead of chasing green candles, learn how to enter when price retraces into a key support zone or moving average.
2️⃣ Dynamic Structure
Understand Break of Structure (BOS) and Change of Character (CHOCH).
Learn why the breakout is often not the entry.
The retest is.
3️⃣ Wyckoff Accumulation
See how smart money accumulates positions, creates shakeouts, traps weak hands, and then drives the markup phase.
Most traders spend years looking for better indicators.
Few spend time understanding structure.
Yet every major trend, breakout, reversal and institutional move leaves structural clues on the chart.
Once you start seeing them, markets begin to make a lot more sense.
If you've ever asked:
• How do I stop chasing stocks?
• How do I identify smart money activity?
• What is BOS and CHOCH in trading?
• How does Wyckoff accumulation work?
• Where should I enter a breakout trade?
This video will help you build that foundation.
Watch the full breakdown and tell me:
Which entry model do you struggle with most?
📚 Courses:
prorsi.com/courses
📖 RSI Mastery:
notionpress.com/in/read/rsi-…
#MarketStructure #SmartMoneyConcepts #PriceActionTrading #WyckoffMethod #BreakOfStructure #CHOCH #TradingStrategy #SwingTrading #StockMarketIndia #TechnicalAnalysis #Nifty50 #BankNifty #PriceAction #TradingEducation #Prorsi
2
3
496
Jun 4
🧠 CRT (Candle Range Theory)📈
Market moves in 3 phases:
Accumulation → Manipulation (sweep) → Distribution
Sweep: Price takes liquidity (fake move)
Real move: Happens after the sweep
📊 Entry (FVG)
Wait for sweep breakout
Enter at Fair Value Gap (FVG)
👉 Don’t enter early wait for manipulation, then trade the real move
#CandleRangeTheory #CRT #SmartMoneyConcepts #SMC #ForexTrading #PriceAction #TradingStrategy #FVG #FairValueGap #LiquiditySweep #MarketStructure #BreakOfStructure #ICTTrading #DayTrading #SwingTrading #ForexEducation #TradingNotes #TechnicalAnalysis #TradeSmart #LearnTrading


1
7
69
2,061
Jun 4
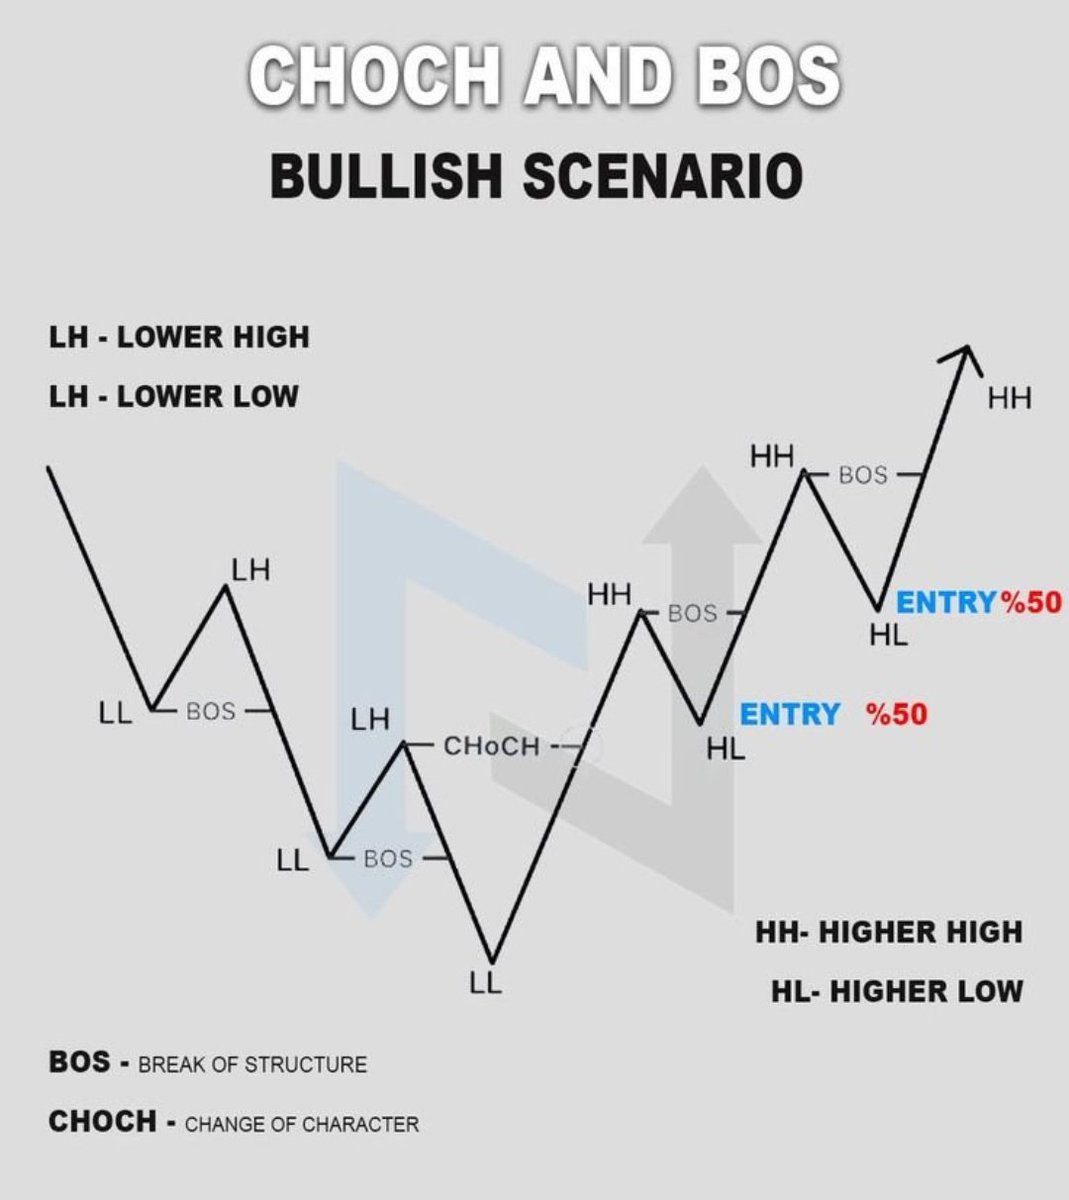
SMC Entry Structure - Example 02 📉
🔹 BOS – Trend continues
🔹 FVG – Price imbalance
🔹 CHoCH – Trend reverses
Simple and clean setup for Smart Money traders. 🧠📊
#SMCEntryModel
#BreakOfStructure
#FairValueGapTrading
#CHOCHConcept
#forextradingeducation

8
38
978

May 22
📊🔥 SMC – SMART MONEY CONCEPT 🔥📊
This whiteboard lesson explains how Smart Money uses HTF Supply, Order Blocks & BOS confirmations to create high-probability sell entries 🚀
✅ BOS confirms market structure direction
✅ HTF Supply zone creates institutional reaction
✅ Aggressive & Confirmation entries explained
✅ CHOCH OB retest provides sniper execution 🎯
💡 In ICT & SMC trading, professional traders wait for structure confirmation and liquidity alignment before entering the market. Precision patience = consistency 📉
t.me/ qq_nzS3yHB9mNzBk
t.me/ qq_nzS3yHB9mNzBk
#SmartMoneyConcepts #ICTTrading #OrderBlock #BreakOfStructure #PriceAction
ICT Trading Lab

1
5
156

#CHOCH
#BOS
Simple and effective...
#Changeofcharacter
#Breakofstructure
#Lowerlow
#Lowerhigh
#Higherhigh
#Higherlow
1
6
310

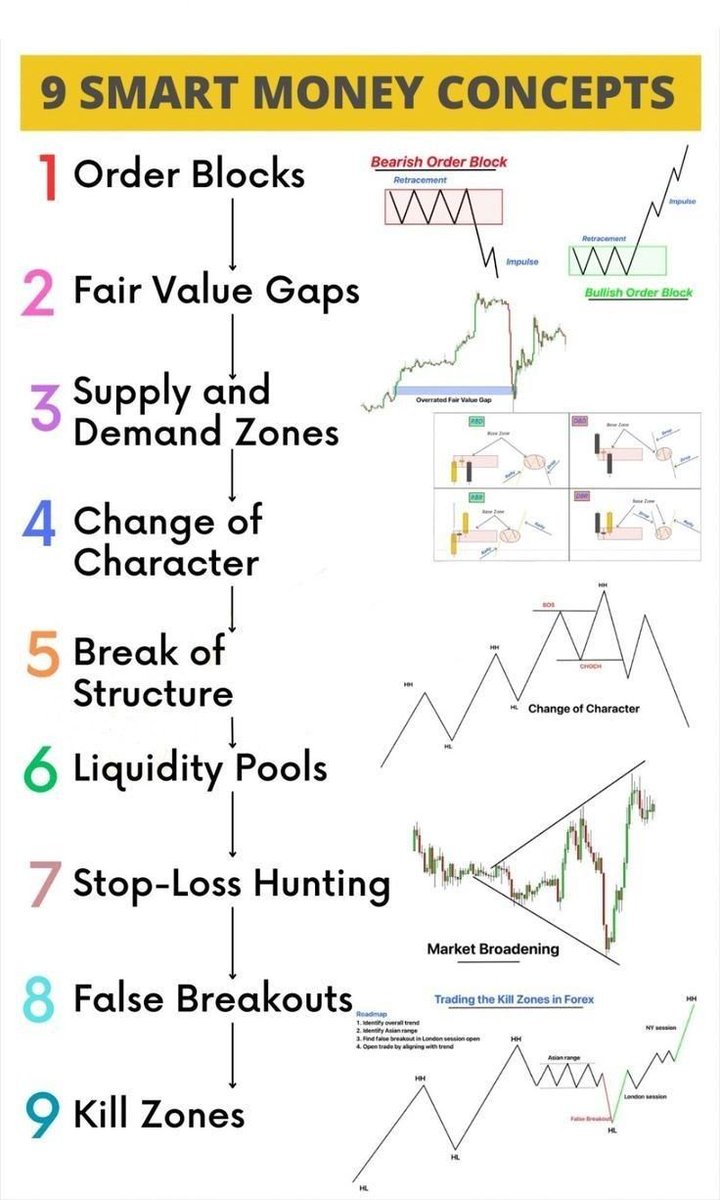
🔥 9 Smart Money Secrets That Can Completely Transform Your Trading Game 🔥
Order Blocks The Footprints Of Big Institutions
Order blocks represent the zones where large institutions place their trades creating strong moves in the market. These areas act as powerful support and resistance because smart money has already shown interest there. When price returns to an order block it often reacts sharply giving traders a high probability setup. Understanding order blocks helps you follow the footsteps of big players instead of trading blindly. The key is to identify strong impulsive moves and mark the last consolidation before that move. This simple concept can dramatically improve your entries and help you trade with confidence and precision.
Fair Value Gaps Hidden Imbalance In Price Movement
Fair value gaps occur when price moves so quickly that it leaves an imbalance between buyers and sellers. These gaps act like magnets as price often comes back to fill them before continuing its move. Traders use these zones to find better entry points with lower risk. A fair value gap shows inefficiency in the market and smart money often revisits these levels to balance orders. Recognizing these gaps can give you a deeper understanding of price action. It allows you to anticipate retracements and avoid chasing trades at the wrong time which improves overall trading performance.
Supply And Demand Zones Where Price Reacts Strongly
Supply and demand zones highlight areas where strong buying or selling previously occurred. Demand zones are where buyers pushed price up while supply zones are where sellers drove price down. These zones help traders identify key turning points in the market. When price revisits these areas it often reacts again creating trading opportunities. The best zones are formed with strong momentum and clear imbalance. Trading near these levels improves risk reward ratio and provides better control over stop loss placement. Mastering supply and demand gives you a clear edge in understanding market behavior.
Change Of Character The First Sign Of Trend Shift
Change of character is an early signal that the market trend might be shifting. It happens when price behavior changes from making higher highs to lower highs or vice versa. This concept helps traders spot reversals before they fully develop. Recognizing this shift allows you to exit losing trades early or prepare for a new trend. It is a powerful tool for staying ahead of the market. When combined with other concepts like order blocks or liquidity it becomes even more effective. Understanding change of character improves timing and helps traders adapt quickly to market conditions.
Break Of Structure Confirmation Of Market Direction
Break of structure confirms the direction of the market by breaking previous highs or lows. In an uptrend a break above a previous high signals strength while in a downtrend a break below a previous low confirms weakness. This concept helps traders avoid false signals and trade with the trend. It provides clarity and removes confusion from decision making. Traders often wait for a clear break before entering a trade to increase probability of success. Combining break of structure with other tools enhances accuracy and builds confidence in executing trades effectively.
Liquidity Pools Where Big Moves Begin
Liquidity pools are areas where many stop losses and pending orders are placed. These zones are often found above highs or below lows where traders cluster their positions. Smart money targets these areas to trigger orders and create momentum. Once liquidity is taken price often moves strongly in the opposite direction. Understanding liquidity helps traders avoid getting trapped and instead take advantage of these moves. It reveals how the market really works behind the scenes. Learning to identify liquidity pools can significantly improve your trading strategy and decision making process.
Stop Loss Hunting The Reality Of Market Manipulation
Stop loss hunting is when price moves to trigger retail traders stop losses before reversing direction. This happens because large players need liquidity to enter big trades. Many traders place stop losses at obvious levels making them easy targets. Understanding this concept helps you avoid placing stops in predictable areas. Instead you can position your trades more strategically and reduce unnecessary losses. Recognizing stop loss hunting also prevents emotional reactions and improves discipline. It is an important concept that separates experienced traders from beginners who often fall into this trap.
False Breakouts Trap That Catches Most Traders
False breakouts occur when price appears to break a key level but quickly reverses trapping traders. These traps are common in the market and often lead to quick losses for those who enter too early. Smart traders wait for confirmation before acting on a breakout. Volume and price behavior play a key role in identifying genuine moves. Understanding false breakouts helps you stay patient and avoid unnecessary risks. It also allows you to take advantage of trapped traders by trading in the opposite direction. This concept is essential for improving accuracy and consistency.
Kill Zones The Most Active Trading Sessions
Kill zones refer to specific times in the market when trading activity is highest such as major session openings. These periods often produce strong moves and high volatility providing the best trading opportunities. Traders focus on these times to find setups with better momentum and clarity. Understanding kill zones helps you avoid low activity periods where price moves randomly. It improves efficiency by allowing you to trade when the market is most active. Combining kill zones with other smart money concepts increases your chances of success and helps you make the most of your trading time.
💡 Conclusion Master Smart Money Concepts And Trade Like A Pro 💡
Smart money concepts provide a deeper understanding of how markets truly operate beyond basic indicators. By learning order blocks fair value gaps supply and demand and other key ideas traders can align themselves with institutional activity. The goal is not just to trade but to trade with logic and strategy. Consistency comes from practice discipline and continuous learning. When you combine these concepts with proper risk management you build a strong foundation for long term success. Stay patient stay focused and keep improving your skills to achieve better results in trading.
Follow for more insights x.com/@anandnst
#smartmoney #trading #stockmarket #technicalanalysis #priceaction #orderblocks #fairvaluegap #supplyandemand #breakofstructure #changeofcharacter #liquidity #stoplosshunting #falsebreakout #killzones #intraday #swingtrading #nifty #banknifty #chartpatterns #traderlife #investing #stocks #sharemarket #tradingstrategy #marketanalysis #finance #wealthbuilding #financialfreedom #equity #futures #options #stockanalysis #learning #tradingeducation #money #profit #riskmanagement #discipline #successmindset #indianstockmarket #sensex #nifty50 #growth #investment #chartanalysis #tradingcommunity #marketstructure #momentum #breakouttrading #volumeanalysis
3
80

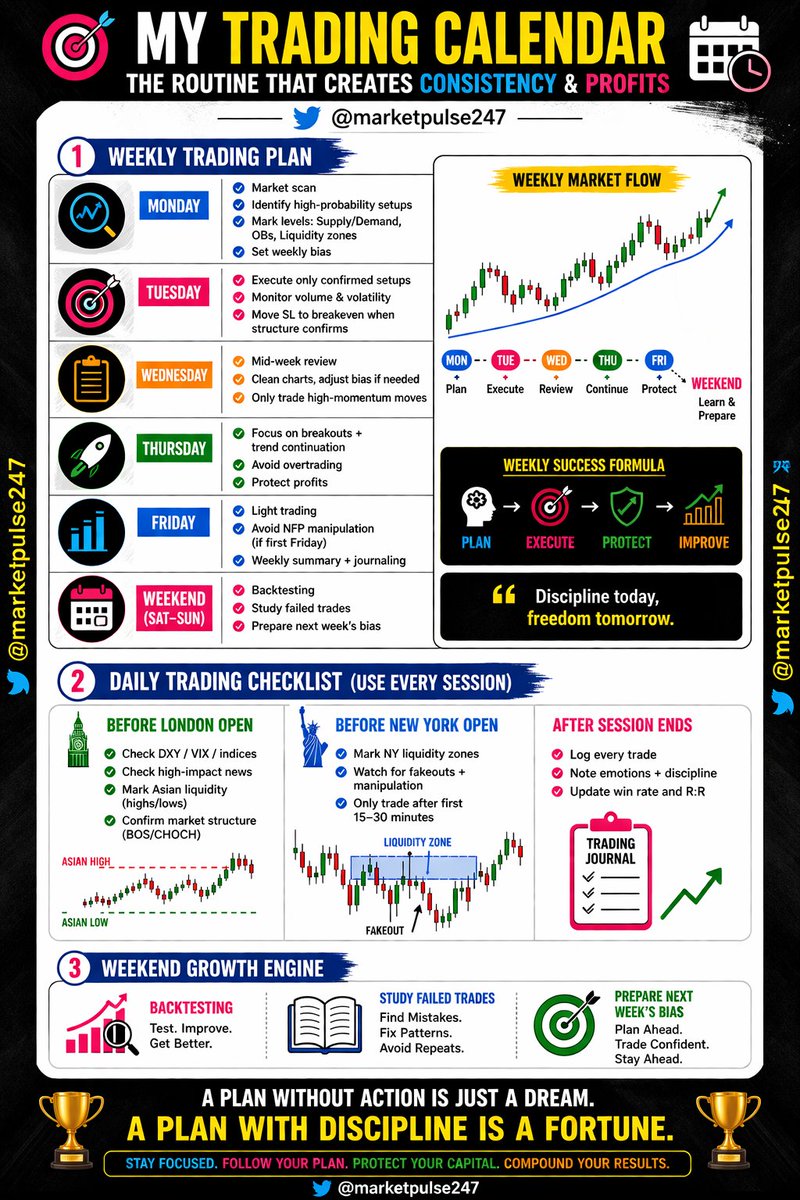
THE PROFESSIONAL TRADER CALENDAR THAT BUILDS CONSISTENT PROFITS
Why structure beats random trading every time
Most traders do not fail because they lack intelligence. They fail because they lack structure. A trading calendar transforms chaos into clarity. When you begin every week with a defined plan you stop reacting emotionally to market noise. Monday becomes your preparation day where you scan the market carefully and identify high probability setups. You mark supply and demand zones order blocks and liquidity areas. You define a clear weekly bias based on structure not opinion. Tuesday shifts focus toward execution but only when confirmation aligns with your plan. You monitor volume and volatility closely and move stop loss to breakeven once structure validates your entry. Wednesday becomes your midweek review where charts are cleaned and bias is adjusted only if structure demands it. Thursday focuses on breakout and continuation trades while protecting profits. Friday remains light and disciplined with journaling and reflection. This structured approach builds long term consistency.
The weekly blueprint that separates amateurs from professionals
Monday is your foundation. You scan markets with patience and filter out low quality setups. Marking levels such as supply zones demand areas order blocks and liquidity pools prepares you for precise entries later in the week. Setting a weekly bias prevents you from chasing every candle. Tuesday is about disciplined execution. Only confirmed setups deserve capital. Watching volume and volatility ensures you trade with momentum not against it. Moving stop loss to breakeven after structural confirmation protects capital and removes emotional pressure. Wednesday serves as a strategic checkpoint. You review open trades reassess market structure and adjust bias only if price action justifies change. Thursday is powerful because breakouts and trend continuation moves often expand before week ends. Yet discipline remains key. Avoid overtrading and protect accumulated gains. Friday demands caution. Liquidity shifts and economic events such as major reports can create manipulation. Light trading and detailed journaling close the week with clarity and learning.
The daily checklist that protects your edge
Every trading session begins before the market opens. Before London open you assess the broader environment. Checking DXY VIX and major indices gives insight into risk sentiment and volatility conditions. Reviewing high impact news prevents unexpected shocks. Marking Asian session highs and lows highlights liquidity zones where stop hunts often occur. Confirming market structure using break of structure and change of character principles ensures alignment with trend. Before New York open you refine your map. Mark New York liquidity zones and watch carefully for fakeouts and manipulation during the first minutes of volatility. Professionals often wait fifteen to thirty minutes before committing capital to avoid early traps. After each session ends you log every trade without exception. You record entry exit reasoning risk reward ratio and emotional state. Tracking win rate and discipline metrics creates accountability. This daily ritual strengthens psychological resilience and refines decision making over time.
Weekend review builds next level growth
Saturday and Sunday are not for random chart watching. They are for deliberate practice. Backtesting historical setups strengthens pattern recognition and confidence. Studying failed trades reveals recurring mistakes that may be invisible during live trading. Reviewing screenshots and journal notes highlights emotional triggers and behavioral weaknesses. Preparing next week bias during the weekend ensures clarity before Monday arrives. Instead of rushing into markets you begin with preparation and purpose. This habit separates reactive traders from strategic operators. Markets reward preparation. Weekend analysis also builds patience because you recognize that opportunities repeat. When you trust your process you no longer feel pressure to trade constantly. You understand that capital preservation and selective aggression create sustainable growth. Continuous learning during quiet hours compounds into sharper decisions during active sessions. Discipline during the weekend translates into precision during the week.
Consistency is built through repetition not excitement
A trading calendar is not about perfection. It is about repetition. Following the same structured routine week after week trains your mind to think in probabilities not impulses. High probability setups become clearer because you are not distracted by noise. Emotional swings reduce because risk is predefined. Journaling transforms losses into lessons rather than frustration. Over time patterns emerge in both markets and behavior. You discover which sessions suit your personality and which conditions reduce your edge. Consistency grows when discipline becomes automatic. Trading success is rarely about one big win. It is about hundreds of small disciplined decisions aligned with a plan.
CONCLUSION STRUCTURE DISCIPLINE AND REVIEW CREATE LONG TERM PROFITS
A professional trading calendar transforms randomness into reliability. Weekly planning sets direction. Daily checklists maintain focus. Session reviews sharpen awareness. Weekend preparation builds confidence. When structure guides every action emotions lose control. Protect capital manage risk and respect your process. Consistency is not luck. It is the result of disciplined repetition and continuous improvement. Master your calendar and you master your trading journey.
If you want more structured trading insights and practical education follow x.com/@marketpulse247 and continue refining your professional routine.
Hashtags
#TradingPlan #TradingRoutine #ForexTrading #StockMarket #TechnicalAnalysis #PriceAction #MarketStructure #RiskManagement #TradingDiscipline #TraderLife #SwingTrading #DayTrading #Investing #TradingPsychology #SmartMoney #Liquidity #SupplyAndDemand #OrderBlocks #BreakOfStructure #CHOCH #Backtesting #TradingJournal #WealthBuilding #FinancialFreedom #MomentumTrading #CapitalProtection #LondonSession #NewYorkSession #MarketBias #Volatility #DXY #VIX #IndicesTrading #BreakoutTrading #TrendTrading #ProfessionalTrader #RetailTrader #LearnTrading #StockEducation #MarketInsights #TradingStrategy #Consistency #MoneyManagement #TradingCommunity #MarketPreparation #ProfitableTrading #EquityMarket #IndianStockMarket #ForexEducation #WealthMindset
3
4
138
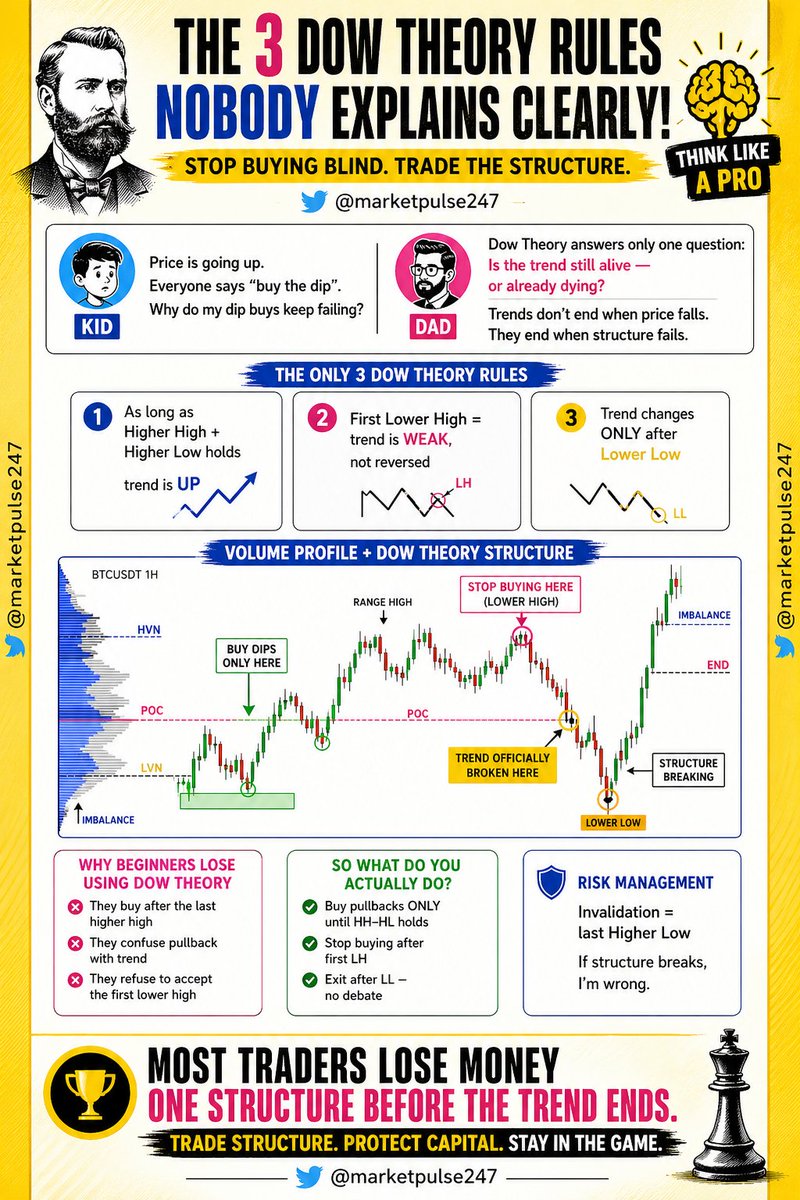
WHY YOUR DIP BUYS KEEP FAILING THE HIDDEN DOW THEORY RULE MOST TRADERS IGNORE
The market is not random your entries are
Most beginners believe that if price is going up the only smart move is to buy every dip. Social media screams buy the dip and traders rush in without understanding structure. Then comes frustration when those dip buys keep failing. The problem is not bad luck. The problem is ignoring trend structure. Dow Theory does not predict tops or bottoms. It answers one powerful question. Is the trend still alive or already dying. An uptrend is defined by higher highs and higher lows. As long as that sequence holds buyers control the market. When that structure weakens smart money becomes cautious. Most retail traders buy because price looks cheap. Professionals buy because structure confirms strength. If you stop focusing on price alone and start focusing on structure your results can completely change.
The three Dow Theory rules nobody explains clearly
There are only three rules you truly need to remember. First as long as higher high and higher low continues the trend is up. That means pullbacks are opportunities not threats. Second the first lower high does not mean reversal. It signals weakness. This is where most traders get trapped. They keep buying aggressively thinking the trend will resume instantly. Third the trend officially changes only after a lower low forms. That is the confirmation that structure is broken. Without a lower low the market is only correcting not reversing. Understanding this sequence gives clarity. Higher high and higher low equals strength. First lower high equals caution. Lower low equals trend change. Trading becomes simple when you respect this progression instead of reacting emotionally to every candle.
Why beginners lose money using Dow Theory
Many traders claim they understand Dow Theory but still lose money because they apply it incorrectly. They buy after the last higher high instead of buying near higher lows. This means they enter when risk is highest not lowest. They confuse a healthy pullback with a full reversal and panic exit early. Or worse they refuse to accept the first lower high and continue buying aggressively even when structure is weakening. Ego becomes expensive. The market does not care about opinions. It respects structure. Most losses happen one structure before the actual trend ends. Traders ignore the first warning sign and keep averaging down. When the lower low finally appears they are already trapped. If you simply stop buying after the first lower high you eliminate a huge percentage of unnecessary losses.
What smart traders actually do differently
Professionals follow a structured process. They buy pullbacks only while higher high and higher low sequence remains intact. They reduce position size or stop buying completely after the first lower high appears. They exit without debate once a lower low confirms trend reversal. There is no emotional argument. There is only structure. Risk management becomes clear because invalidation is defined. In an uptrend the last higher low is the line in the sand. If price breaks below it the trade idea is wrong. This clarity removes confusion and hesitation. Instead of predicting what the market should do they react to what the market is showing. That shift in mindset separates consistent traders from hopeful gamblers. Structure first opinion last becomes the guiding rule.
Risk management is the real edge
The most powerful part of Dow Theory is not entries. It is invalidation. Every trade must have a clear point where you admit you are wrong. In an uptrend that point is the last higher low. If structure breaks you exit. No excuses no averaging no hope. This simple discipline protects capital and keeps you in the game long term. Most traders lose money not because they cannot spot trends but because they refuse to respect structure breaks. Capital preservation allows you to survive until the next clean trend forms. When you combine structural clarity with disciplined exits you stop reacting emotionally to noise. You begin operating with logic. And that is when consistency begins.
CONCLUSION STRUCTURE WINS OPINIONS LOSE
Dow Theory is not complicated. It is brutally simple. Buy pullbacks while higher highs and higher lows hold. Stop buying after the first lower high. Exit after the lower low confirms reversal. Define invalidation at the last higher low. Most traders lose money one structure before the trend actually ends because they ignore warning signs. If you master structure instead of chasing price you transform your trading mindset. Follow structure protect capital stay patient and let the market confirm your bias before committing aggressively. That is how professionals trade and that is how consistency is built.
x.com/@marketpulse247
Hashtags
#DowTheory
#PriceAction
#StockMarket
#Trading
#TechnicalAnalysis
#SmartMoney
#MarketStructure
#TrendTrading
#SwingTrading
#DayTrading
#Investing
#TraderLife
#FinancialFreedom
#RiskManagement
#CapitalProtection
#HigherHigh
#HigherLow
#LowerHigh
#LowerLow
#TrendReversal
#PullbackTrading
#BreakOfStructure
#VolumeProfile
#ChartAnalysis
#TradingPsychology
#Discipline
#WealthBuilding
#EquityMarket
#Nifty
#BankNifty
#IndianStockMarket
#CryptoTrading
#BTCUSDT
#MomentumTrading
#MarketEducation
#LearnTrading
#RetailTrader
#ProTrader
#TradingStrategy
#StockEducation
#InvestmentTips
#MoneyManagement
#TechnicalTrader
#MarketWisdom
#TradeSmart
#FollowTheTrend
#ChartPatterns
#MarketInsights
#TradingCommunity
#WealthMindset
3
4
130
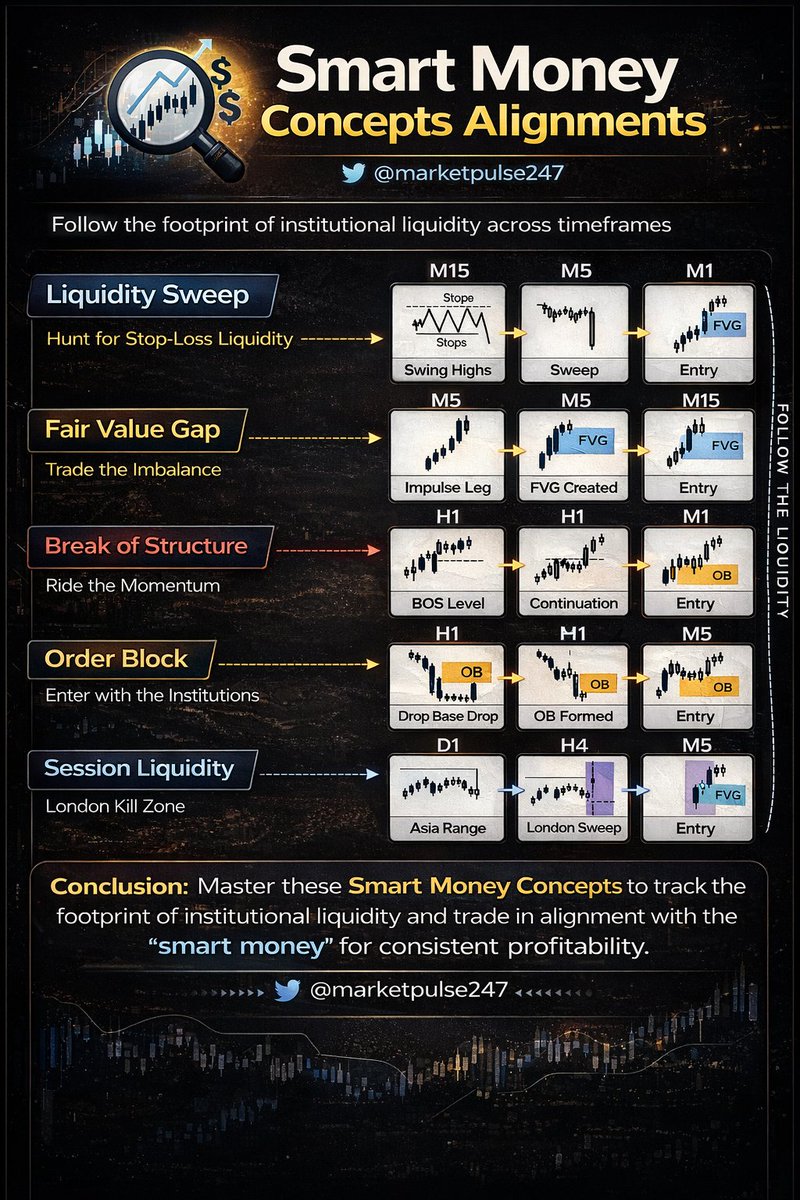
🚀 SMART MONEY CONCEPTS ALIGNMENTS – MASTER THE MARKET LIKE INSTITUTIONS
@marketpulse247
If you want to trade like professionals and not like the crowd, understanding Smart Money Concepts (SMC) is a game changer. Institutions move the market — and your goal is to follow their footprint. Let’s break down these powerful concepts in a simple, point-to-point format so your viewers can easily understand and apply them.
🔍 1. Liquidity Sweep – The Trap Before the Move
Market makers target stop-loss liquidity placed by retail traders.
Price often moves above swing highs or below swing lows to grab liquidity.
This move is usually a fake breakout.
After the sweep, price quickly reverses direction.
Best strategy: Wait for confirmation (like rejection on lower timeframe) before entering.
👉 Pro Tip: Never enter during breakout blindly — wait for the liquidity grab!
⚖️ 2. Fair Value Gap (FVG) – The Imbalance Zone
FVG forms when price moves aggressively, leaving an imbalance.
It represents areas where buyers and sellers were not balanced.
Price often comes back to fill this gap before continuing.
These zones act as high-probability entry points.
👉 Pro Tip: Combine FVG with trend direction for better accuracy.
📈 3. Break of Structure (BOS) – Trend Confirmation
BOS confirms a change in market direction or continuation.
When price breaks a previous high → bullish signal.
When price breaks a previous low → bearish signal.
After BOS, price often comes for a retest before continuation.
👉 Pro Tip: Don’t chase the move — wait for retest entry.
🏦 4. Order Block (OB) – Institutional Entry Zones
Order blocks are areas where big players (institutions) enter trades.
Usually seen before a strong impulsive move.
Price returns to these zones for mitigation.
These are powerful zones for low-risk entries.
👉 Pro Tip: Look for OB BOS combo for high-probability trades.
🌍 5. Session Liquidity – Timing is Everything
Different trading sessions behave differently.
Asia Session: Consolidation (range formation).
London Session: Liquidity sweep (fake moves).
New York Session: Real move begins.
“London Kill Zone” is a key time where big moves start.
👉 Pro Tip: Trade during high volatility sessions for better results.
🔗 Multi-Timeframe Alignment – The Real Edge
Combine higher timeframe bias (H1/H4) with lower timeframe entry (M5/M1).
Follow this structure:
HTF → Identify trend
LTF → Find entry (FVG / OB / Sweep)
This alignment increases accuracy and confidence.
👉 Pro Tip: Always trade in the direction of the higher timeframe trend.
⚡ Why Smart Money Concepts Work
Markets are controlled by institutions, not retail traders.
SMC helps you understand how and where money flows.
It removes emotional trading and replaces it with logic-based decisions.
🧠 Common Mistakes to Avoid
Entering without confirmation
Ignoring higher timeframe trend
Overtrading in low volatility
Not managing risk properly
✅ CONCLUSION: TRADE LIKE SMART MONEY, NOT THE CROWD
Mastering Smart Money Concepts is not just about learning strategies — it’s about understanding how the market truly works. When you align Liquidity Sweeps, Fair Value Gaps, Break of Structure, and Order Blocks with proper timing, you gain a powerful edge over retail traders. Stay patient, follow the process, and most importantly — trade with discipline. That’s how consistent profitability is achieved in the market.
@Marketpulse247
x.com/@marketpulse247
#SmartMoneyConcepts #SMCTrading #LiquiditySweep #FairValueGap #OrderBlock #BreakOfStructure #ForexTrading #StockMarketIndia #IntradayTrading #PriceActionTrading #TradingStrategy #InstitutionalTrading #MarketStructure #ICTTrading #ForexEducation #StockMarketLearning #TechnicalAnalysis #TradingTips #DayTrading #ScalpingStrategy #BankNifty #Nifty50 #OptionsTrading #ChartAnalysis #CandlestickPatterns #TradingPsychology #RiskManagement #FinancialFreedom #WealthCreation #TraderLife #StockMarketTips #LearnTrading #BeginnerTrading #ProTrader #MarketAnalysis #TradeSmart #SmartTrading #MoneyManagement #TradingCommunity #BullishMarket #BearishMarket #TradeLikePro #MarketPulse #IndianStockMarket #marketpulse247
5
7
139
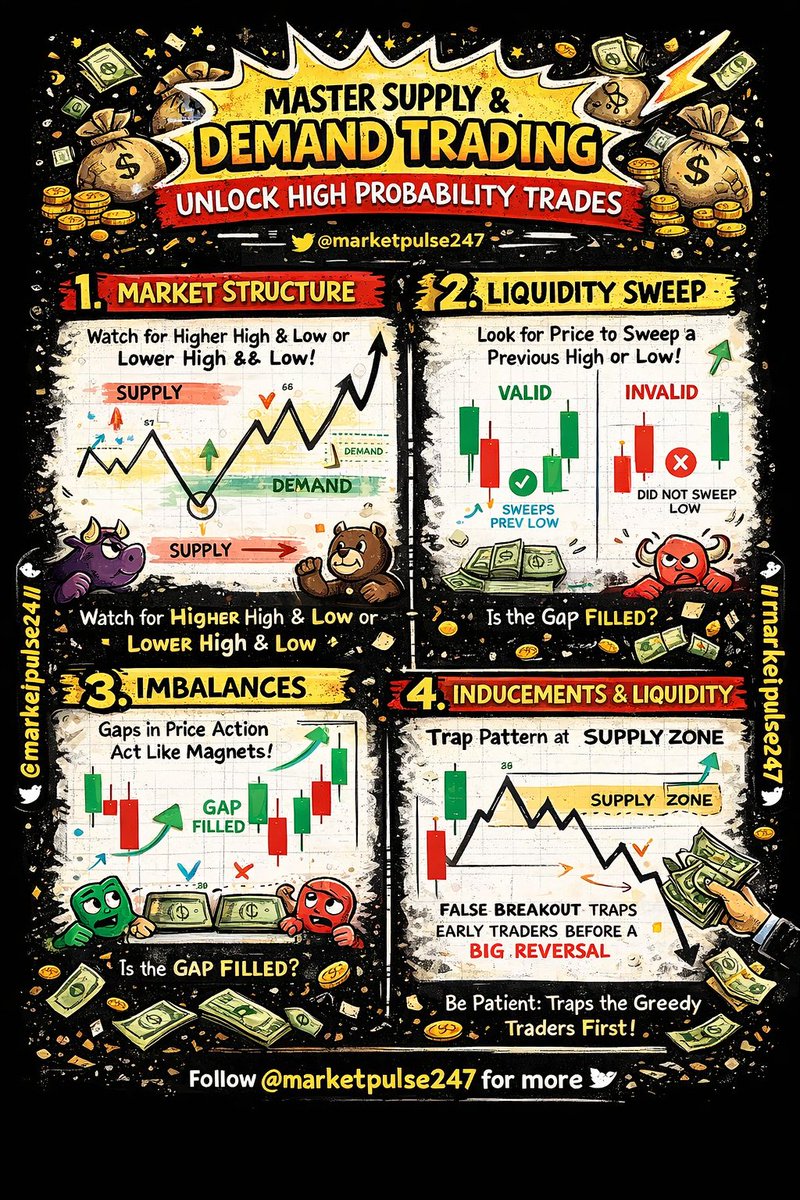
MASTER HIGH-PROBABILITY TRADES: SIMPLE GUIDE TO SUPPLY & DEMAND ZONES
Trading becomes easier when you stop guessing and start understanding where the market is likely to move. Supply and demand zones help traders identify these high-probability areas. Instead of chasing price, you learn to wait for price to come to you.
The first concept is market structure. The market moves in patterns of higher highs, higher lows, lower highs, and lower lows. When price breaks a structure (BOS – Break of Structure), it signals a potential shift in direction. For example, if a stock keeps making lower lows and suddenly breaks above a previous high, it may indicate a trend reversal. This is where smart traders start paying attention.
Supply zones are areas where price previously dropped sharply, showing strong selling pressure. Demand zones are where price moved up quickly, showing strong buying interest. A simple real-life example: think of a product on sale. When the price drops to a “cheap” level (demand zone), buyers rush in. When the price becomes “expensive” (supply zone), sellers dominate.
The second key factor is liquidity sweep. Markets often move to take out previous highs or lows before reversing. This traps traders who enter too early. A valid setup is when price sweeps a previous low and then quickly reverses upward from a demand zone. An invalid setup is when price doesn’t take that liquidity and simply moves sideways or weakly.
Next comes imbalance. This happens when price moves very fast in one direction, leaving a gap or inefficiency. These gaps often act like magnets, pulling price back before continuing the move. For example, if a stock suddenly jumps due to news, it may come back slightly to fill that imbalance before moving higher again.
Another important concept is break of structure combined with imbalance. When both happen together, it increases the probability of a successful trade. Imagine a stock breaking resistance with strong momentum and leaving gaps behind. This shows strength and increases confidence in the move.
Finally, inducement or liquidity traps play a big role. The market often creates fake moves to trap traders before the real move begins. For instance, price may form a small upward move near a supply zone, attracting buyers, and then sharply drop. This is why patience is critical.
In real life, these concepts apply to any market—stocks, forex, or crypto. A disciplined trader waits for confirmation: a liquidity sweep, a clear demand or supply zone, and a break of structure. Rushing into trades without these confirmations often leads to losses.
In conclusion, supply and demand trading is about understanding behavior, not predicting the future. By focusing on market structure, liquidity, imbalances, and patience, you can identify high-probability setups. The goal is not to trade more, but to trade smarter.
x.com/@marketpulse247
#SupplyAndDemand #TradingStrategy #SmartMoneyConcepts #PriceActionTrading #ForexTrading #StockMarketIndia #IntradayTrading #SwingTrading #TradingEducation #MarketStructure #BreakOfStructure #LiquiditySweep #ImbalanceTrading #DemandZone #SupplyZone #TradingSetup #TechnicalAnalysis #ChartAnalysis #TradingTips #TraderMindset #TradingPsychology #LearnTrading #BeginnerTrading #AdvancedTrading #TradingLife #ConsistentTrader #RiskManagement #TradeSmart #TradingSignals #MarketAnalysis #PriceAction #SniperEntries #TradingCommunity #ForexIndia #StockMarketLearning #TradeLikeAPro #FinancialFreedom #WealthCreation #PassiveIncomeTrading #MoneyMakingIdeas #TradingDiscipline #ChartPatterns #TrendTrading #ScalpingTrading #CryptoTrading #Nifty50 #BankNifty #InvestSmart #MarketPulse247
1
2
39
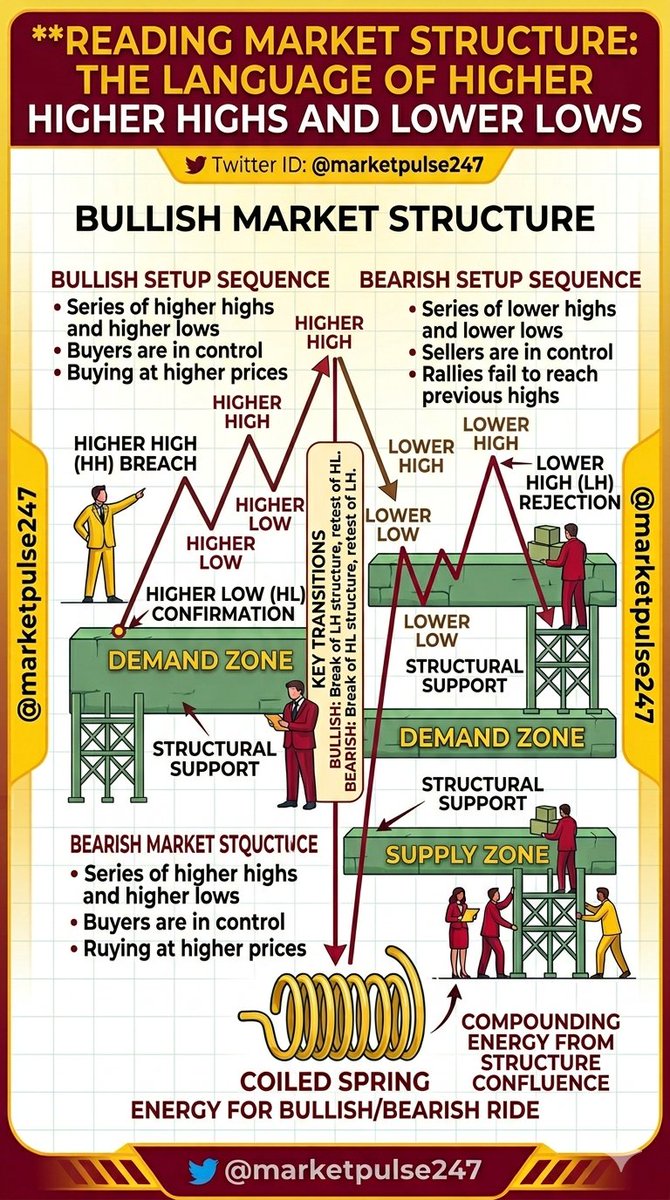
Reading Market Structure: The Language of Higher Highs and Lower Lows
Market structure is the foundation of technical analysis. It is the framework that tells you where price has been, where it is currently, and what it is attempting to do next. Without understanding structure, you are trading blind. You might get lucky occasionally, but consistency will always remain out of reach.
The image breaks down the core elements of market structure in a visual way. It shows the constant battle between supply and demand, between buyers pushing for higher highs and sellers creating lower lows. When you learn to read these patterns, you stop guessing and start understanding what the market is actually telling you.
Let me break this down point by point so it becomes crystal clear.
What Is Market Structure?
Market structure is simply the sequence of highs and lows that price creates over time. It tells you whether the market is in an uptrend, a downtrend, or a period of consolidation. Every trader should be able to look at a chart and identify these patterns within seconds.
Bullish Market Structure
A bullish or uptrend structure is defined by a series of higher highs and higher lows. This means each new peak is higher than the previous peak, and each new trough is higher than the previous trough.
When you see this pattern, it tells you that buyers are in control. They are willing to buy at higher prices, and sellers are unable to push price down to previous low levels. The demand zone in this structure is the area where buyers consistently step in to defend the trend.
Bearish Market Structure
A bearish or downtrend structure is the opposite. It is defined by a series of lower highs and lower lows. Each new peak is lower than the one before, and each new trough is lower than the previous trough.
This tells you sellers are in control. Every rally fails to reach the previous high, and sellers continue to push price to new lows. The supply zone in this structure is where sellers consistently step in to push price down.
Key Terms to Understand
Higher High. A peak that exceeds the previous peak in an uptrend. It confirms bullish momentum.
Higher Low. A trough that is above the previous trough. It shows that buyers are defending higher levels.
Lower High. A peak that is below the previous peak in a downtrend. It shows sellers are gaining strength.
Lower Low. A trough that is below the previous trough. It confirms bearish momentum.
Supply Zone. An area where selling pressure overwhelms buying pressure. Price tends to reverse or stall here.
Demand Zone. An area where buying pressure overwhelms selling pressure. Price tends to bounce or find support here.
When Structure Fails
One of the most critical concepts in market structure is what happens when a pattern fails. The image highlights the phrase failed to break the high. This is a warning sign.
In an uptrend, you expect price to continue making higher highs. When price approaches a previous high and fails to break it, that is a sign of weakening momentum. It suggests buyers are losing interest. If price then breaks below a previous higher low, the structure has officially shifted from bullish to bearish.
Conversely, in a downtrend, if price fails to make a lower low and then breaks above a previous lower high, the bearish structure is compromised.
How to Use Market Structure in Trading
Identify the current structure before placing any trade. Know whether you are in an uptrend, downtrend, or range.
Wait for a break of structure to signal a potential trend change. Do not anticipate reversals. Let price show you.
Use supply and demand zones within the structure. In an uptrend, look to buy from demand zones. In a downtrend, look to sell from supply zones.
Protect your trades with invalidation levels. If you are buying in an uptrend, your stop loss belongs below the most recent higher low. If price breaks that low, the structure is no longer bullish.
Conclusion
Market structure is not a complicated concept, but it requires discipline to follow. The sequence of higher highs and higher lows tells you when to be bullish. The sequence of lower highs and lower lows tells you when to be bearish. When those patterns break, it tells you to step aside and reevaluate.
The traders who succeed are not the ones with the most complex indicators. They are the ones who can look at a chart, identify the structure in seconds, and make decisions based on what price is actually doing rather than what they hope it will do.
Learn to read the language of higher highs, higher lows, lower highs, and lower lows. Let supply and demand zones guide your entries. And always respect when structure fails. That simple framework will keep you on the right side of the market more often than not.
x.com/@marketpulse247
#MarketStructure #HigherHigh #HigherLow #LowerHigh #LowerLow #SupplyAndDemand #TechnicalAnalysis #PriceAction #SmartMoneyConcepts #ICTtrading #SMC #TrendAnalysis #Uptrend #Downtrend #BreakOfStructure #BOS #ChartPatterns #TradingStrategy #Forex #StockMarket #CryptoTrading #DayTrading #SwingTrading #PriceActionTrading #SupplyZone #DemandZone #TradingEducation #LearnToTrade #TradingTips #ForexTrader #Nifty #BankNifty #SP500 #BTC #GoldTrading #CrudeOil #TradingCommunity #ForexLife #TradingDaily #RiskManagement #TradingPsychology #MarketAnalysis #ChartMaster #TechnicalTrading #FinancialFreedom
3
5
142
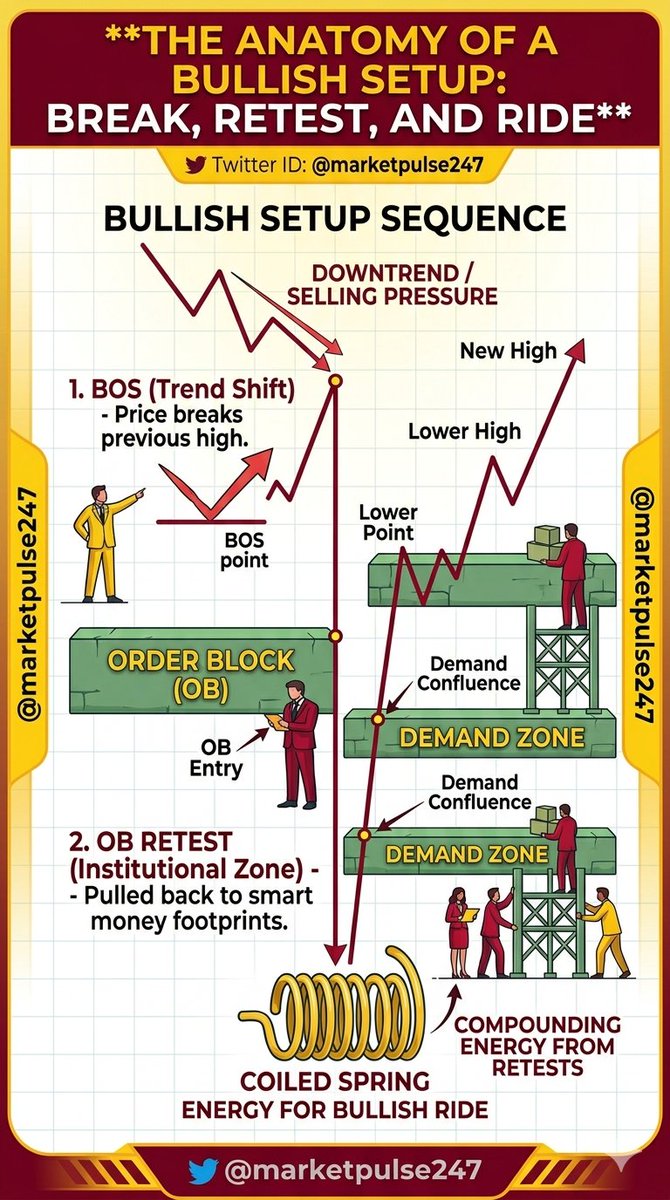
**The Anatomy of a Bullish Setup: Break, Retest, and Ride**
There is a rhythm to how markets move. It is not random chaos, though it often feels that way when you are staring at a screen without a framework. The image captures that rhythm in a way that many traders spend years trying to understand. It shows a bullish structure built on three key elements. A break block reversal. An order block retest. And a demand retest. When these three pieces align, you are looking at a high probability setup.
Let me walk you through what this actually means on a chart.
It all starts with a break of structure, often abbreviated as BOS. In a downtrend, price is making lower lows and lower highs. Then something changes. Price breaks above a previous high, signaling that the selling pressure is weakening. This initial move is often fueled by liquidity grabs. The market sweeps out stop losses, takes out the last of the sellers, and begins to reverse direction.
This first move creates what is called a break block reversal. It is the first clue that the trend may be shifting. But here is the thing. Most traders see this break and jump in immediately. That is usually a mistake. The market rarely goes straight up after a reversal. It needs to breathe.
That is where the order block retest comes in. After the initial reversal, price often pulls back to an area where institutional orders were placed. This is the order block. It represents a zone where smart money entered positions. When price returns to this zone and shows signs of holding, you have your first opportunity to enter with the trend.
The third piece is the demand retest. Demand zones are areas where buyers have historically stepped in with conviction. When price pulls back to a demand zone after a break of structure and aligns with an order block, you get confluence. Multiple factors pointing to the same area. That is where the highest probability trades exist.
From there, the structure continues. Price makes a new high. Then it pulls back to retest a demand zone again. Then another new high. Each retest offers another opportunity for those who missed the initial entry. The trend is confirmed by successive breaks of structure to the upside.
What makes this approach powerful is that it removes the guesswork. You are not predicting where price will go. You are identifying where smart money has already left footprints and waiting for price to return to those areas. You are trading the retest, not the initial breakout. That patience keeps you out of false breakouts and gives you clear invalidation levels.
The image also highlights the importance of understanding the difference between a break block reversal and a simple breakout. A break block is not just price moving higher. It is a structural shift. It tells you that the previous trend has been interrupted. When that happens and price returns to the order block or demand zone that initiated the move, you have a clean setup with defined risk.
Conclusion
Trading a bullish structure is not about catching the absolute bottom or the exact top. It is about understanding the sequence of events that signal a trend change and then waiting for price to offer you a low risk entry. The break block tells you something has shifted. The order block retest gives you the zone. The demand retest confirms that buyers are still present.
When you learn to recognize this three step process, you stop chasing price and start waiting for price to come to you. That is the difference between gambling and trading with an edge. The market will always offer retests. Your job is to recognize them, trust your structure, and execute with discipline. Do that consistently, and you will find yourself riding trends rather than getting run over by them.
x.com/@marketpulse247
#BullishSetup #BreakOfStructure #OrderBlock #DemandZone #SmartMoneyConcepts #ICTtrading #PriceAction #TechnicalAnalysis #Forex #StockMarket #CryptoTrading #SMC #BreakBlockReversal #OrderBlockRetest #DemandRetest #TrendTrading #MarketStructure #PriceActionTrading #TradingStrategy #SwingTrading #DayTrading #SupplyAndDemand #InstitutionalTrading #SmartMoney #LiquidityGrab #BOS #ChartPatterns #TradingTips #ForexTrader #Nifty #BankNifty #SP500 #BTC #GoldTrading #CrudeOil #TradingEducation #LearnToTrade #TradingCommunity #ForexLife #TradingDaily #RiskManagement #TradingPsychology #ConfluenceTrading #HighProbabilitySetup #FinancialFreedom
3
6
163

Mar 14
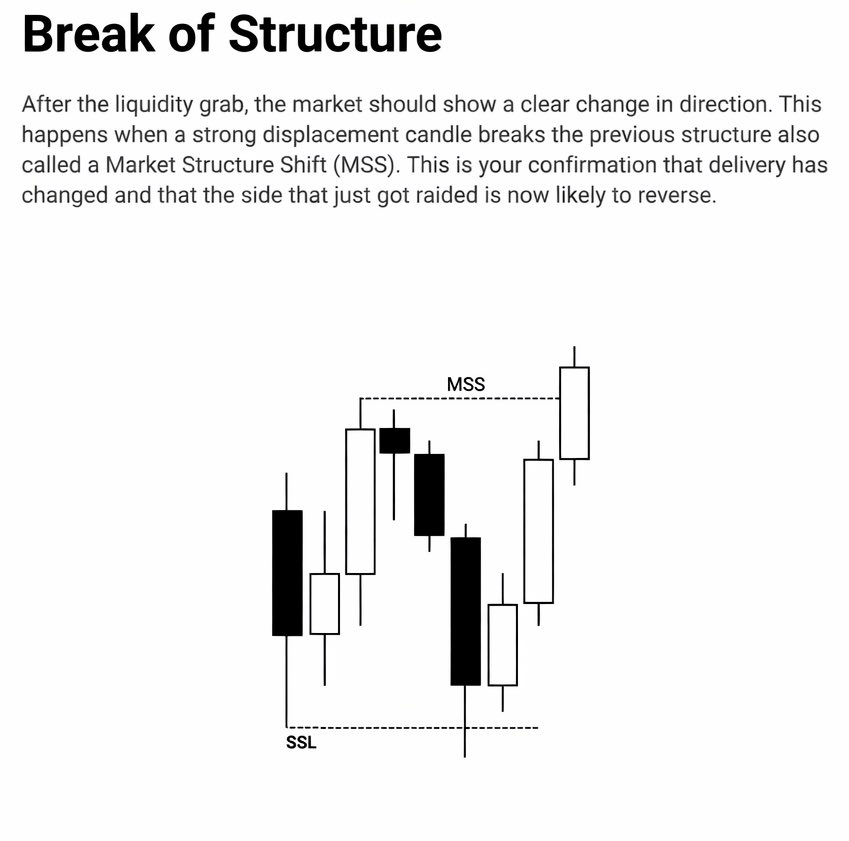
Understanding Break of Structure in trading 👇
Many traders try to predict when the market will reverse.
They see price moving up or down and immediately assume the direction will change.
But professional traders wait for confirmation from market structure.
One of the most important confirmations in price action is the Break of Structure (BOS), also known in ICT concepts as Market Structure Shift (MSS).
A Break of Structure happens when price violates the previous swing structure with strong displacement.
This tells us that the market is no longer delivering price in the same direction.
In other words, the narrative has changed.
But the key thing many traders misunderstand is that BOS rarely happens randomly.
Before the structure breaks, the market often performs a liquidity raid.
Price moves above equal highs or below equal lows to trigger stop losses and resting liquidity.
This creates the fuel needed for the next move.
Once liquidity is taken, the market often shows a strong displacement candle.
That displacement is what drives price through the previous structure, creating the Break of Structure.
This moment is extremely important because it signals that order flow has shifted.
The side that just got trapped is now likely on the wrong side of the market.
Smart money traders use this shift to position themselves in the new direction.
But the real edge comes from understanding what happens after the Break of Structure.
Price often retraces into inefficiencies such as:
• Fair Value Gaps
• Order Blocks
• Liquidity voids
This retracement gives traders the opportunity to enter with defined risk.
Instead of chasing the move, they wait for price to return to a high-probability area before continuing in the new direction.
The biggest mistake traders make is trying to trade before structure breaks.
They anticipate the reversal instead of waiting for confirmation.
Patience is what separates amateurs from professionals.
Because once you understand how liquidity raids lead to displacement and then Break of Structure, the market stops feeling random.
And you begin to see the algorithmic delivery of price.
⸻
📊 Remember:
Liquidity first.
Displacement second.
Break of Structure confirms the shift.
That’s when the real move begins.
#Bos #breakofstructure #mss #ICTCONCEPT
3
12
584

Feb 23
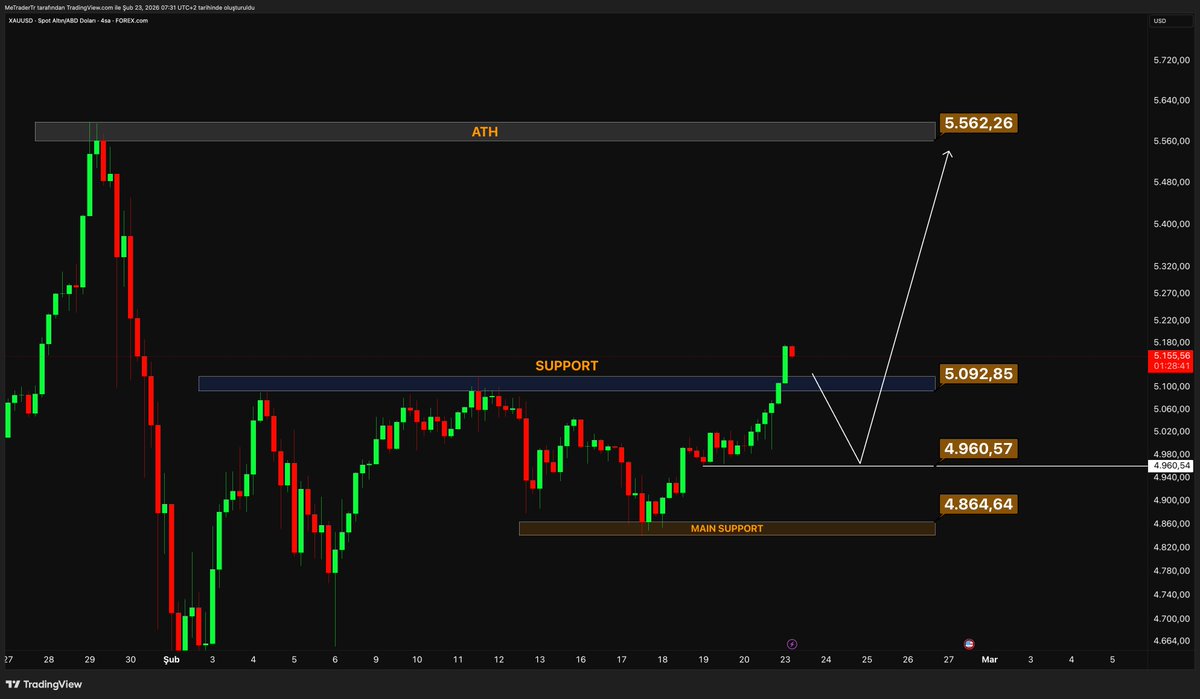
#XAUUSD 4H 5092$ Üzeri Yapısal Güçlenme İhtimali...
TradingView tr.tradingview.com/chart/XAU…
#XAUUSD
#Gold
#PriceAction
#BreakOfStructure
#Fibonacci
#Liquidity
#SafeHaven
#TechnicalAnalysis
#MeTrader
2
739

Jan 25
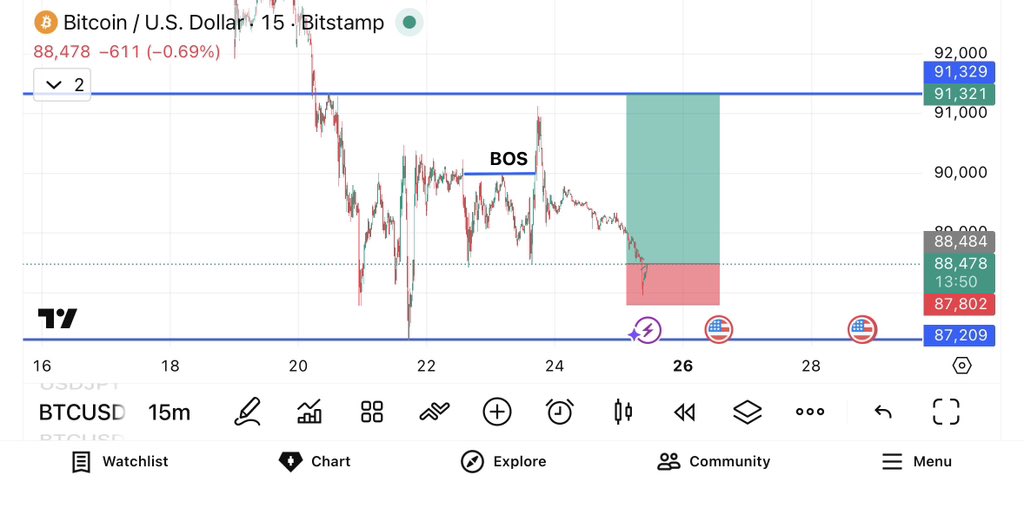
BTCUSD 15M 💣 VIP ALERT
Liquidity sweep ✔️
BOS ✔️
Smart money active from 87.2K 🚀
Next explosion: 91K → 92K ⚡
Don’t blink… this move is VIOLENT.
👉 Join VIP Telegram for live entries:
🔗 t.me/Tradebeats111
#BTC #BTCUSD #Bitcoin
#VIPSignals #CryptoVIP #SmartMoney
#LiquidityGrab #BreakOfStructure
3
5
126