
Master the Pullback: A Deep Dive into Trading with Fibonacci Retracement
The world of trading often feels like trying to read a map while driving through a storm. Most traders chase the green candles, jumping into a "strong move" only to realize they bought at the very top, just as the pros are starting to sell. If you have ever felt that sting of FOMO (Fear Of Missing Out), it is time to stop chasing and start calculating. The Fibonacci Retracement tool is not just a fancy set of numbers on a chart; it is a psychological blueprint of how markets breathe. By understanding the "ABC" rhythm of price action, you can turn a missed opportunity into a calculated, high-probability entry.
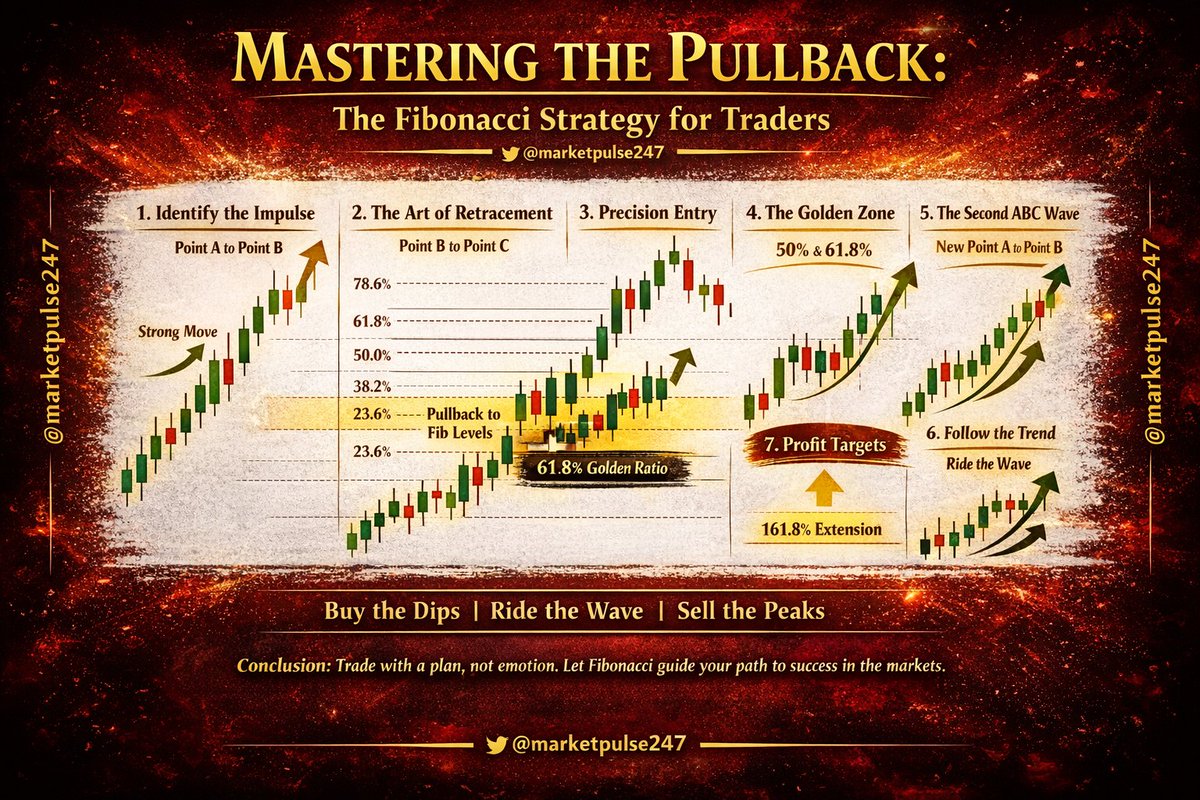
1. Identifying the Initial Impulse
Every great trade begins with a strong, decisive move. In a bullish market, this is a vertical climb where the bulls are clearly in control. Most novice traders see this move and panic because they are not in it. However, a professional looks at a "Point A to Point B" move as the setup. You are not looking to buy the peak; you are waiting for the market to exhaust itself temporarily so you can get in at a "wholesale" price.
2. The Art of the Retracement
Markets never move in a straight line. After the surge from Point A to Point B, the market will inevitably pull back. This is known as a retracement. This is the moment you pull out your Fibonacci tool. By drawing it from the swing low (Point A) to the swing high (Point B), you reveal the hidden levels where buyers are likely lurking. These levels—23.6%, 38.2%, 50%, 61.8%, and 78.6%—act as invisible floorboards. They tell you exactly where the "correction" might end and the "trend" might resume.
3. Precision Entry Strategies
Once the price begins to dip into your Fibonacci zone, you have two primary ways to play it. The first is using "Pending Orders," placing a limit buy at a specific level like the 61.8% "Golden Ratio." This is for the confident trader who trusts the level. The second, and often safer, method is to wait for price action signals. You look for a bullish engulfing candle or a long wick rejecting a Fibonacci level. This is the market’s way of saying, "The floor is holding."
4. Navigating the Golden Ratios
While there are many levels, the 50% and 61.8% levels are the heavy hitters. In a healthy trend, the market often retreats to these areas to gather "liquidity." Think of it like an archer pulling back the string of a bow; the further the retracement (to a point), the more energy is stored for the next launch. When you see a bounce at the 61.8% mark, you are looking at one of the most reliable reversal patterns in technical analysis.
5. Tracking the Second ABC Wave
Trading is about repetition. Once the price bounces off a Fibonacci level (let’s call this Point C), it usually heads toward new highs. This creates a secondary move. A sophisticated trader doesn't just stop at the first win. They look at the "Green Circles" on the chart, recognizing that the previous Point C has now become the new "First Point A." The cycle repeats, allowing you to ladder into positions as the trend matures, maximizing your gains while managing your risk at every step.
6. The Shift in Perspective
The magic of Fibonacci is that it turns a chaotic chart into a structured environment. Instead of guessing where a trend might stop, you are using mathematical ratios derived from nature itself. By connecting new Points A and B as the market climbs, you stay synced with the trend's heartbeat. You transition from a gambler hoping for a miracle to a strategist waiting for a specific price at a specific level.
7. Managing the Exit and Extension
It is not enough to know where to get in; you must know where the move might end. Beyond the retracement levels lie the extension levels, such as the 161.4%. This is often where a trend finally hits its ceiling. By using Fibonacci for both entry and exit, you create a complete trading system. You buy the dips and sell the extensions, staying one step ahead of the crowd that is still trading based on "gut feeling" rather than geometric reality.
Conclusion: Fibonacci is more than just a tool; it is a discipline that forces you to trade with patience and precision. By waiting for the market to come to your pre-defined levels, you eliminate the emotional stress of chasing price. Remember, the strongest trends are those that respect their retracements. Master the ABC move, trust the Golden Ratio, and you will find yourself trading with a level of clarity and confidence you never thought possible. Success in the markets isn't about being first to the party; it is about being the one who knows exactly when the real music starts.
x.com/@marketpulse247
#Trading #Crypto #Stocks #Forex #Fibonacci #TechnicalAnalysis #Investing #DayTrading #PriceAction #FinancialFreedom #WealthBuilding #TradingStrategies #ChartPatterns #MarketAnalysis #TradingTips #Bitcoin #Ethereum #BullMarket #PassiveIncome #SmartMoney #TradingLifestyle #MoneyMindset #StockMarket #InvestmentStrategy #TechnicalIndicator #FinancialLiteracy #ProfitableTrading #OnlineTrading #TradingEducation #MarketPsychology #SwingTrading #Scalping #FibonacciRetracement #GoldenRatio #TrendFollowing #RiskManagement #WealthManagement #SuccessInTrading #FinancialEducation #TradersLife #MarketInsights #CryptoTrading #StockTips #TradingSignals #EconomicFreedom #DigitalAssets #ChartAnalysis #InvestSmart #TradingCommunity #ProfessionalTrading
1
3
95
👨🎓 TRAINING GUIDE N°1⃣2⃣8⃣ 👩🎓
🔹 Indicator - Repulse 🔹
🔗 centralcharts.com/en/gm/1-le…
⚡️ #Trading #Trader #StockExchange #FinancialMarkets #Forex #StockMarkets #TradingStrategy #TechnicalAnalysis #TechnicalIndicator #Repulse
2
38

15 Sep 2025
In this special video, audience will learn how to correctly use the important #Forex index, RSI. Make use of the index to be more profitable than ever! 💰📈📗
Surely you won't want to miss it ⬇️
ow.ly/zb8w50WWAHW
#Trading #TechnicalIndicator
1
2
6
1,557

7 Sep 2025
Check out how to check for the The High Blast setups:-
youtu.be/P0dxBWIG_-A?si=0Jjj…
#technicalindicator #trading #StockMarkets
3
391

5 Jun 2025
👨🎓 TRAINING GUIDE N°1⃣3⃣1⃣ 👩🎓
🔹 Indicator - Aroon 🔹
🔗 centralcharts.com/en/gm/1-le…
⚡️ #Trading #Trader #StockExchange #FinancialMarkets #Forex #StockMarkets #TradingStrategy #TechnicalAnalysis #TechnicalIndicator #Aroon
1
22

21 Mar 2025
CLSA का टेक्निकल इंडिकेटर
बाजार में खरीदारी का सिग्नल
सिग्नल के बाद कितनी तेजी?
क्या है Breadth Buy सिग्नल?
@AshishZBiz #CLSA #TechnicalIndicator #stockmarket @AnilSinghvi_
2
13
113
12,433
21 Mar 2025
CLSA के टेक्निकल इंडिकेटर पर आया एक सिग्नल!
क्या है इसका मतलब? सिग्नल के बाद कितनी तेजी?
जानिए @AshishZBiz से
#CLSA #TechnicalIndicator #stockmarket @AnilSinghvi_
13
1,660

14 Feb 2025
Aptos On The Move—Can APT Break Resistance and Surpass $7?
deythere.com/aptos-flashes-b…
#APTPriceTrend #APTOS #AptosPricePrediction #TechnicalIndicator #Blockchain #Market #News
1
2
55

17 Oct 2024
The Alligator Indicator explained
The Alligator indicator consists of 3 different smoothed moving averages and is useful for recognizing price trends.
chartmill.com/documentation/…
#ChartMill #alligator #technicalanalysis #technicalindicator #chartmill #stockscreener #trendindicator

2
174

24 Aug 2024
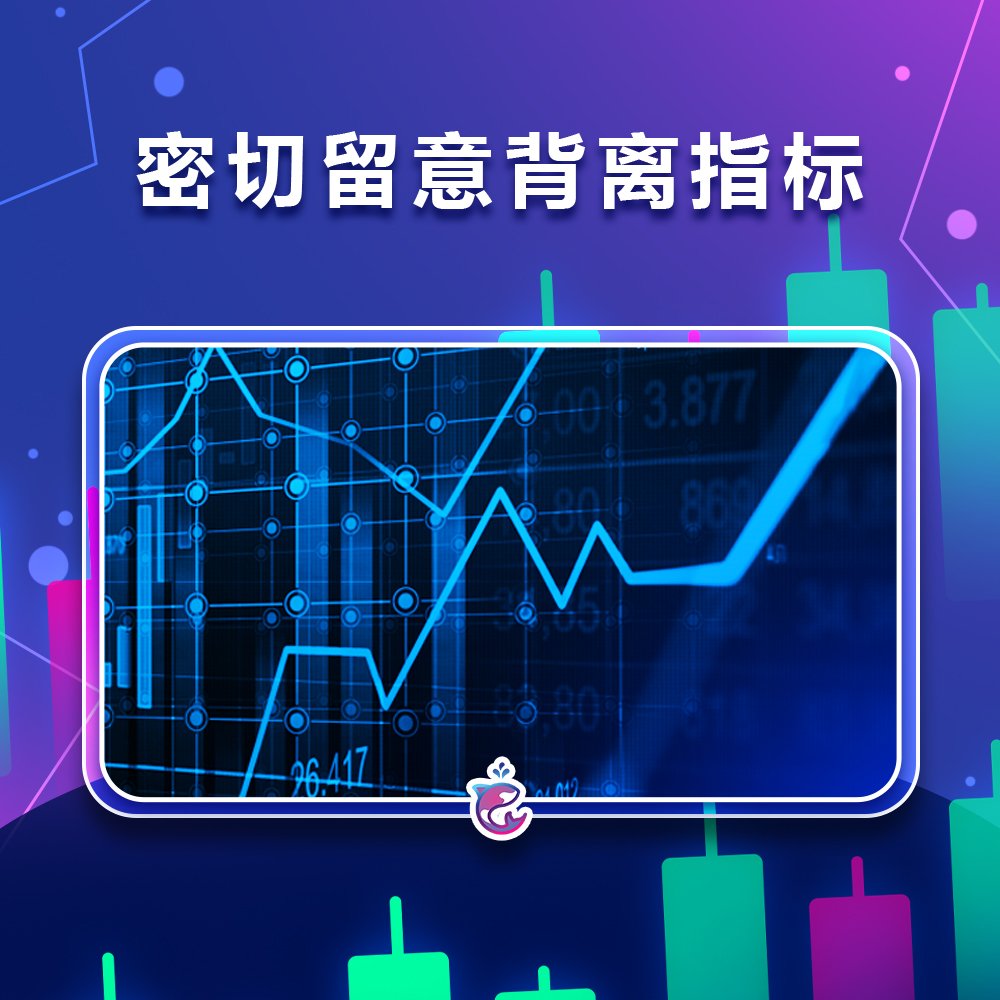
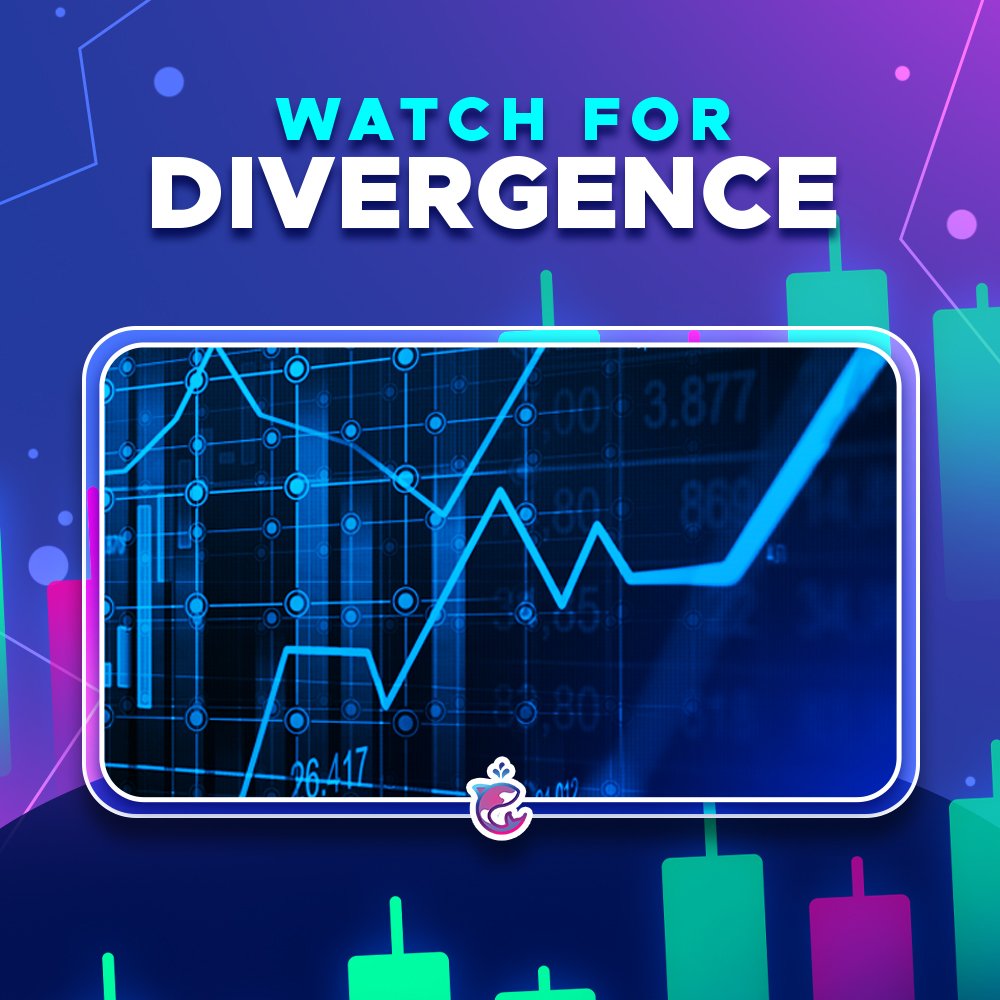
密切留意背离指标以获得更好的交易契机!👀📊 分析价格与 RSI 或 MACD 等指标之间的背离,以预测潜在的反转。交易策略将领先于曲线。 #DivergenceTrading #TechnicalIndicator #
3
130
24 Aug 2024
Spot divergence for better trades! 👀📊 Look for divergence between price and indicators like RSI or MACD to predict potential reversals. Trade ahead of the curve. #DivergenceTrading #TechnicalIndicator #Aquacity
3
5
5
211

4 Jun 2024
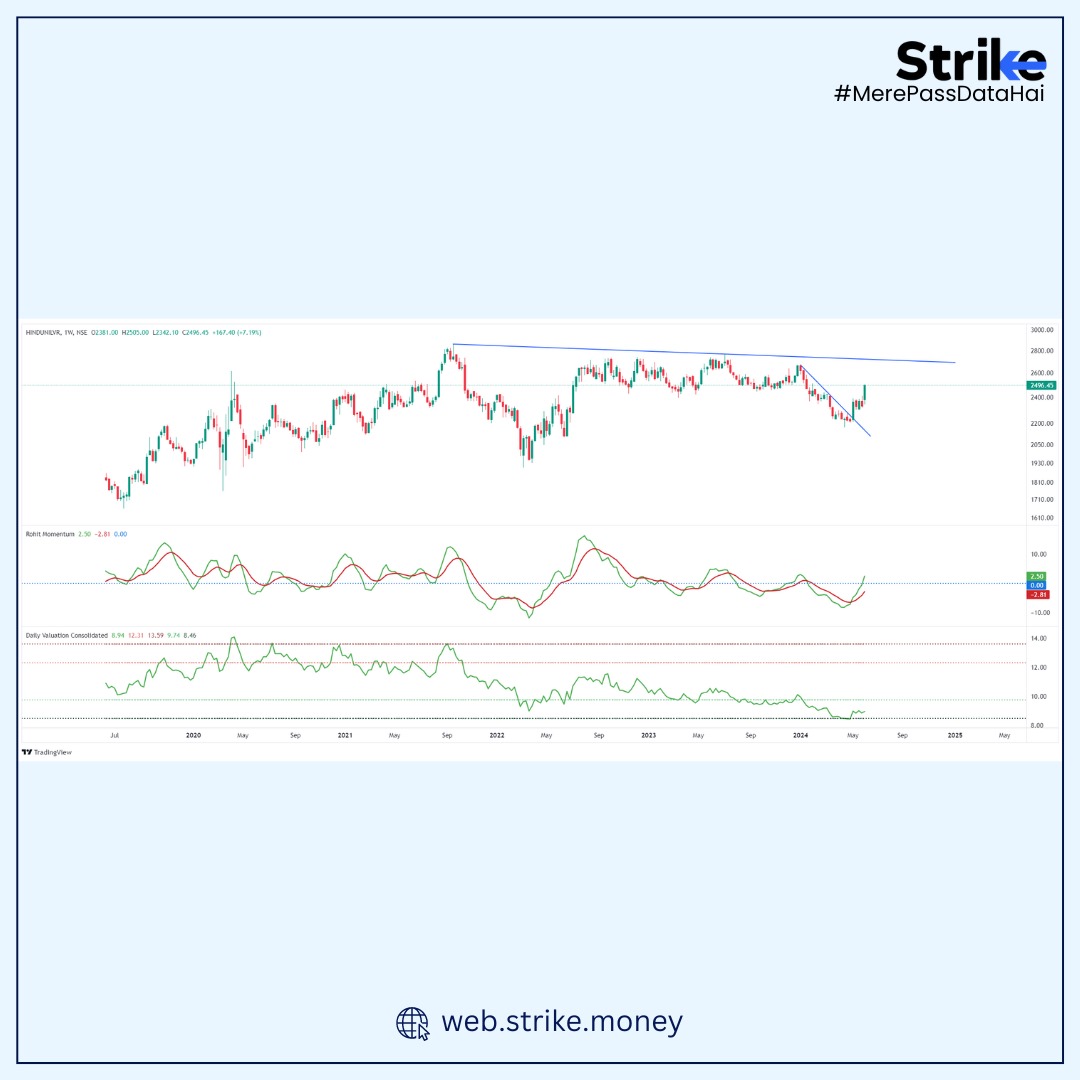
Hindustan Unilever - This FMCG counter shows an interesting setup. The valuation (M.Cap/Sales) ratio is bouncing from -2 SD levels on a 5-year chart and the RMI has turned bullish on multiple timeframes. The trendline of highs is still about 10% away.
Start your journey with Strike. Sign for 7 day free trial here- bit.ly/strike_twitter
#fmcg #rmi #strike #technicalindicator #marketanalysis #marketwatch #valuationsetup #hindustanUnilever
2
1
6
2,894
3 Jun 2024
Which indicator do you find most effective for trend analysis?
#trendanalysis #scanners #technicalscanner #technicalindicator #strike
5%
Value Wave Model
58%
Rohit Scanner
16%
Dow Trend Scanner
21%
Diffusion Indicators
19 votes • Final results
2
686

18 Dec 2023
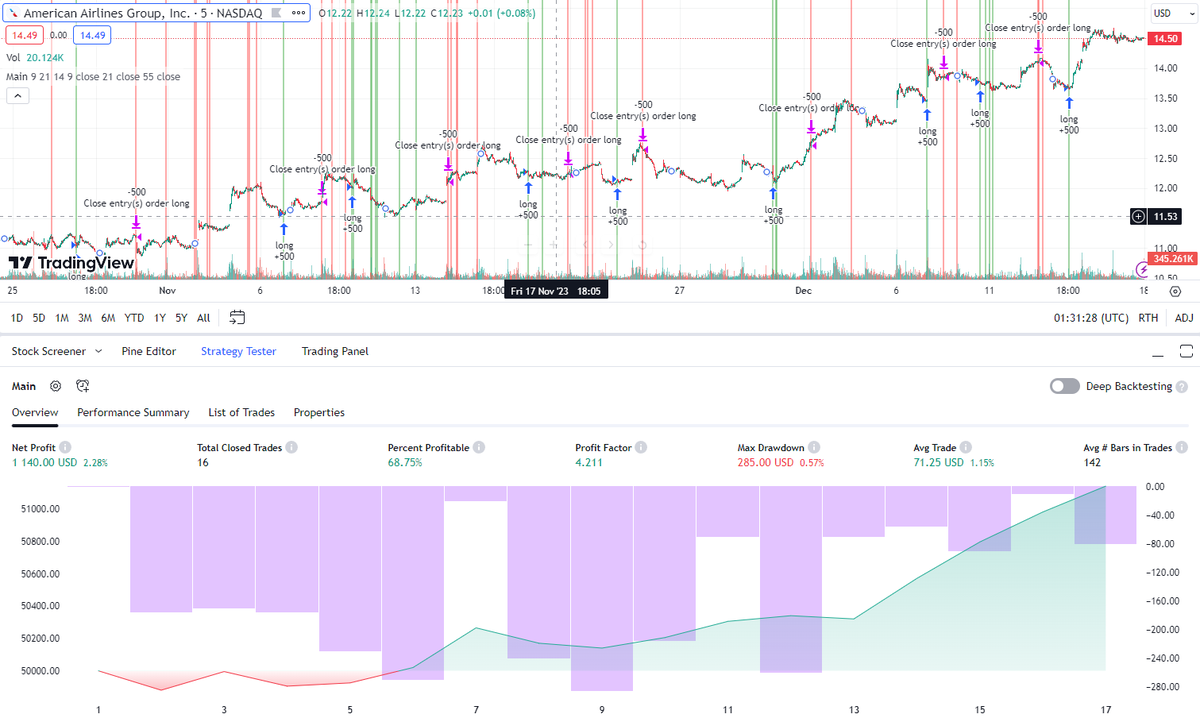
📈 Exciting news! We just finished testing one of our new cutting edge custom indicators! 🚀For this test we traded $AAL for 7 weeks📊 What are some of your favorite indicators? #StockTrading #Investing #technicalindicator #FinancialFreedom $aal
2
50

24 Nov 2023
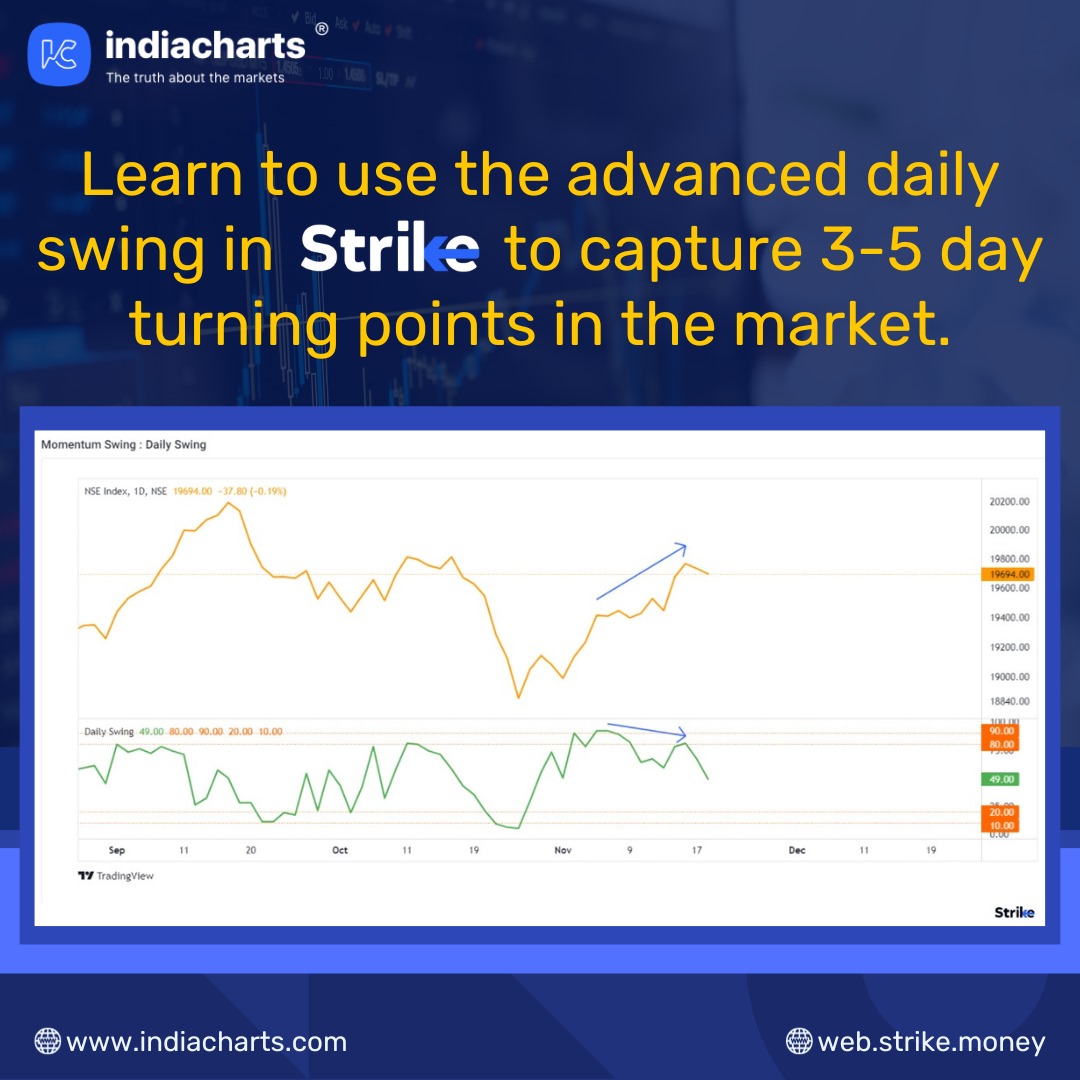
The momentum swing technical indicator developed a negative divergence with Nifty recently. Sentiment reached a near term high and reversed. Price action often follows and its worth looking at for short term traders to find the next good entry point.
Learn to use the advanced daily swing in Strike to capture 3-5 day turning points in the market.
Get started with STRIKE analytics and speed up your analysis and decision making process. Sign up for a free trial today - bit.ly/strike_twitter
#MomentumSwing #TechnicalIndicator #DivergenceAlert #STRIKEAnalytics
3
2,780

9 Nov 2023
2/
To set a stop loss, a trader must first identify a price point at which they no longer will want to hold the position 👁️
This can be set:
👉 A percentage below the entry price
👉 A specific price level
👉 Below a #technicalindicator like the moving average or support level
3
117
128
1,113
2 Nov 2023
👨🎓 TRAINING GUIDE N°1⃣2⃣1⃣ 👩🎓
🔹 Indicator - Chande Momentum Oscillator 🔹
🔗 centralcharts.com/en/gm/1-le…
⚡️ #Trading #Trader #StockExchange #FinancialMarkets #Forex #StockMarkets #TradingStrategy #TechnicalAnalysis #TechnicalIndicator
2
41
24 Oct 2023
👨🎓 TRAINING GUIDE N°1⃣7⃣2⃣ 👩🎓
🔹 Indicator - RSI Divergences 🔹
🔗 centralcharts.com/en/gm/1-le…
⚡️ #Trading #Trader #StockExchange #FinancialMarkets #Forex #StockMarkets #TradingStrategy #TechnicalAnalysis #TechnicalIndicator #RSI
2
40

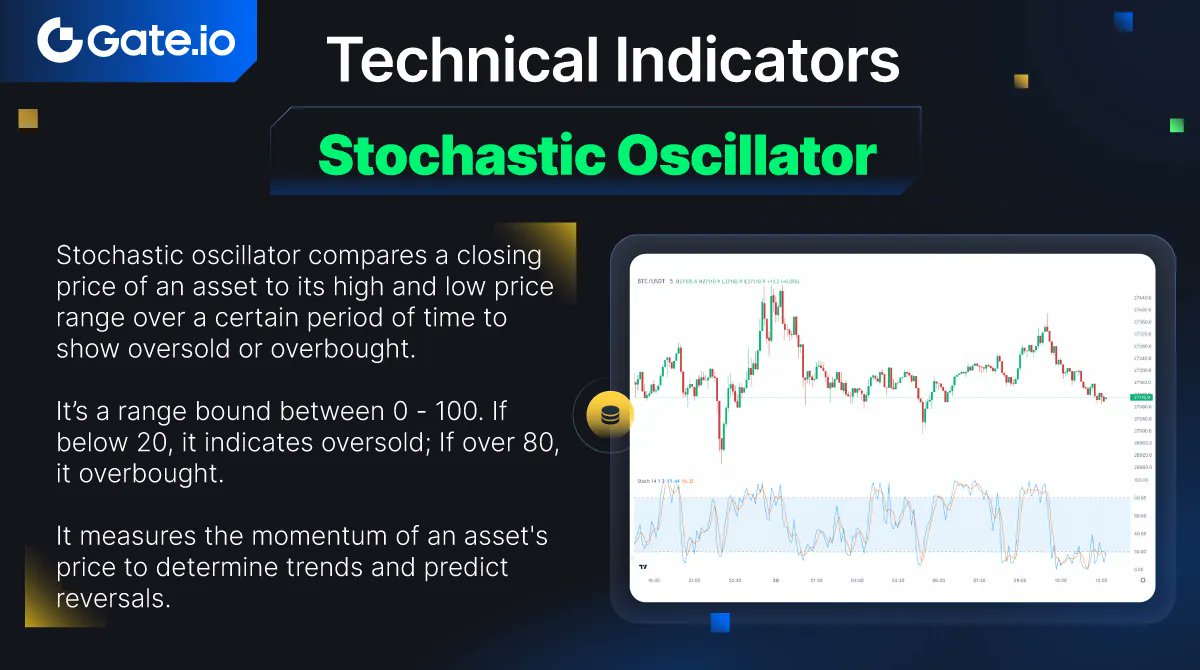
#TechnicalIndicator - Stochastic Oscillator
How can we identify an asset's overbought or oversold by Stochastic Oscillator?
Check it out in the image below👇
29
2
27
9,736

14 Sep 2023
When your trading strategy involves more technical indicators than your computer can handle, it might be time to simplify 🖥️📈💡 #KeepItSimple #Nifty #BankNifty #TechnicalIndicator #PriceActionTrading #HGTrades
2
81