
Jun 12
For years, Andhra Pradesh's education story was about transformation.
Ten years from now, nobody will remember this year's budget speech. Nobody will remember a government order. Nobody will remember a political slogan.
But the children sitting in Andhra Pradesh's classrooms today will live with the consequences of those decisions for the rest of their lives.
So what does the data actually say about the state of education?
Between 2022-23 and 2023-24, many of the state's education indicators moved in the right direction. Enrolment increased, transition rates remained exceptionally high and the momentum created by large-scale public investment appeared intact.
But the latest UDISE data raises some uncomfortable questions:
Total enrolment fell by nearly 2.9 lakh students in 2024-25
Dropout rates increased across preparatory, middle and secondary stages
Transition rates weakened at every stage of schooling
Education's share of the state budget fell from 14.7% in 2021-22 to 11.7% in 2026-27, below the all-state average in 2025-26.
At the same time, Andhra Pradesh invested over ₹46,000 crore between 2019 and 2024 through programmes such as Nadu-Nedu, Amma Vodi, Vidya Kanuka, Vidya Deevena and Vasathi Deevena, attempting one of the largest public-school transformation efforts in the country.
So what changed?
And more importantly: Is Andhra Pradesh building on that transformation or is the momentum beginning to slow?
A data-driven analysis based on UDISE , budget documents and official records: x.com/DeccanDoctrine/status/…
#AndhraPradesh #APEducation #EducationPolicy #PublicEducation #GovernmentSchools #NaduNedu #AmmaVodi #VidyaKanuka #VidyaDeevena #VasathiDeevena #SchoolEducation #UDISE #UDISEPlus #EducationReform #EducationalDevelopment #HumanCapital #LearningOutcomes #EducationBudget #Budget2026 #APPolitics #NaraLokesh #ChandrababuNaidu #YSJagan #PawanKalyan #YSRCP #TDP #JSP #EducationForAll #SchoolTransformation #PolicyAnalysis #DeccanDoctrine #Amaravati

1
5
10
430

महाराष्ट्र शासन विकासाच्या नावाखाली हजारो कोटी खर्च करत आहे, पण UDISE 2024–25 अहवाल उघडपणे सांगतो की शिक्षणाच्या मूलभूत सुविधांपासून आजही गरीब, ग्रामीण आणि आदिवासी भागातील मुले वंचित आहेत.
अनेक शाळांमध्ये ICT Lab नाही, वीज नाही, इंटरनेट नाही, डिजिटल साधने नाहीत, स्वच्छ शौचालये नाहीत ही परिस्थिती विकासाची नाही व्यवस्थेवर प्रश्नचिन्ह उपस्थित करणारे आहे .
रस्ते, पूल आणि इमारती उभ्या राहतील, पण शिक्षण मजबूत नसेल तर महाराष्ट्राचे भविष्य कोसळेल.
आता केवळ योजना, घोषणा आणि फाईलवरील विकास नकोत , शाळांमध्ये प्रत्यक्ष बदल हवा, तातडीने हवा !
@Dev_Fadnavis @mieknathshinde @ChDadaPatil @dadabhuse @maharashtraedu @EduMinOfIndia @abpmajhatv @TV9Marathi
#SaveEducation #MaharashtraEducation #UDISEPlus #RightToEducation #DigitalDivide
2
4
134

Jan 31
The Odisha School Education Programme Authority (OSEPA) organized a State-level Technical Workshop on UDISE 2025–26 data finalization today at the Auditorium Hall, Govt. Boys’ High School, Unit-I, Bhubaneswar.
The workshop focused on UDISE data sharing and gap analysis, the status of PGI indicators, and Dropbox data, ahead of school-level certification.
District Education Officers, ADEOs (Scheme), and District MIS Programmers participated, aiming to strengthen data accuracy and ensure timely completion.
#UDISEPlus #SamagraShiksha #EducationData #PGI


11
4
69
2,435

2 Dec 2025
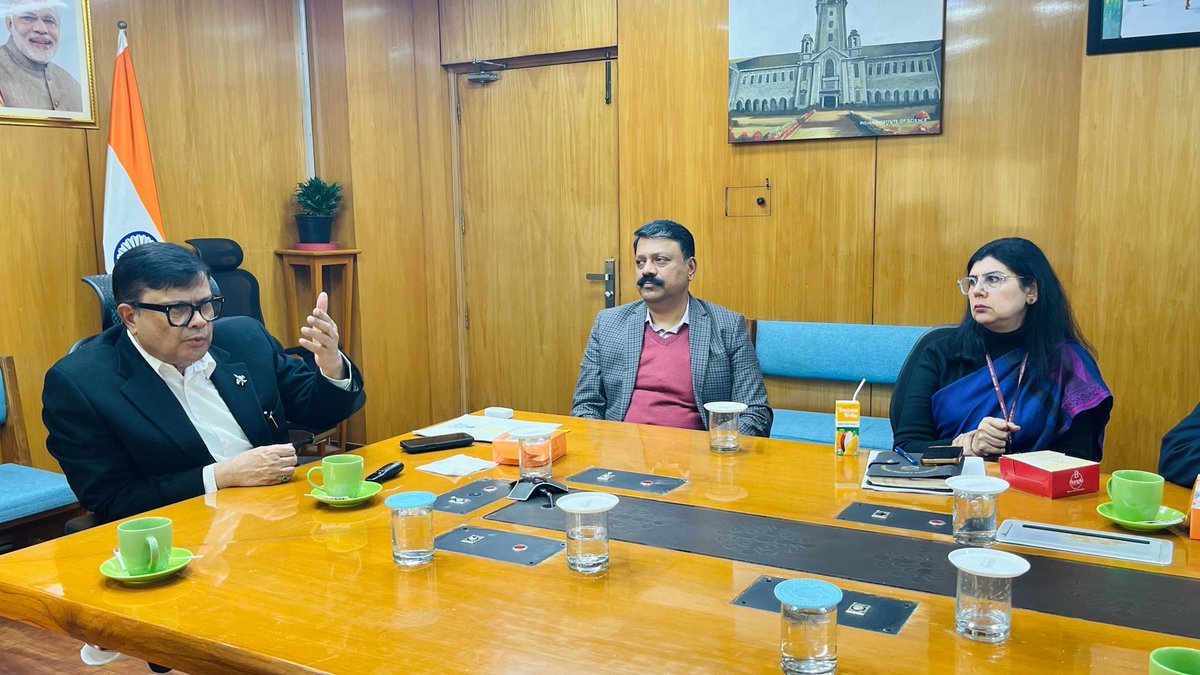
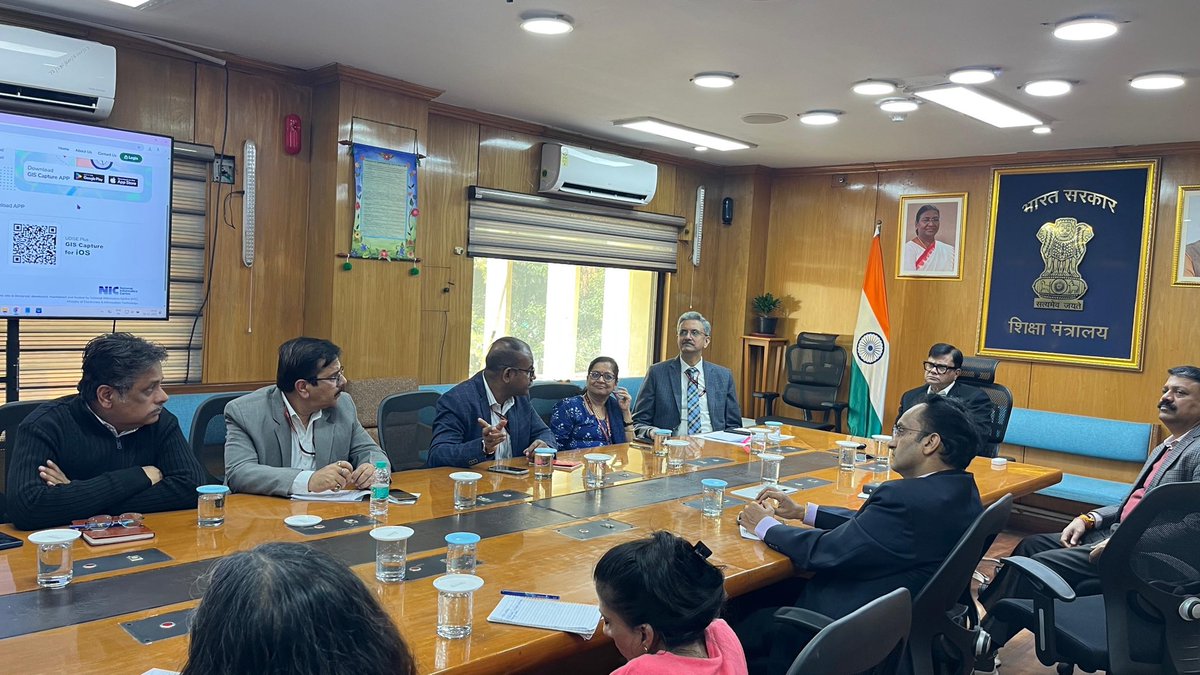
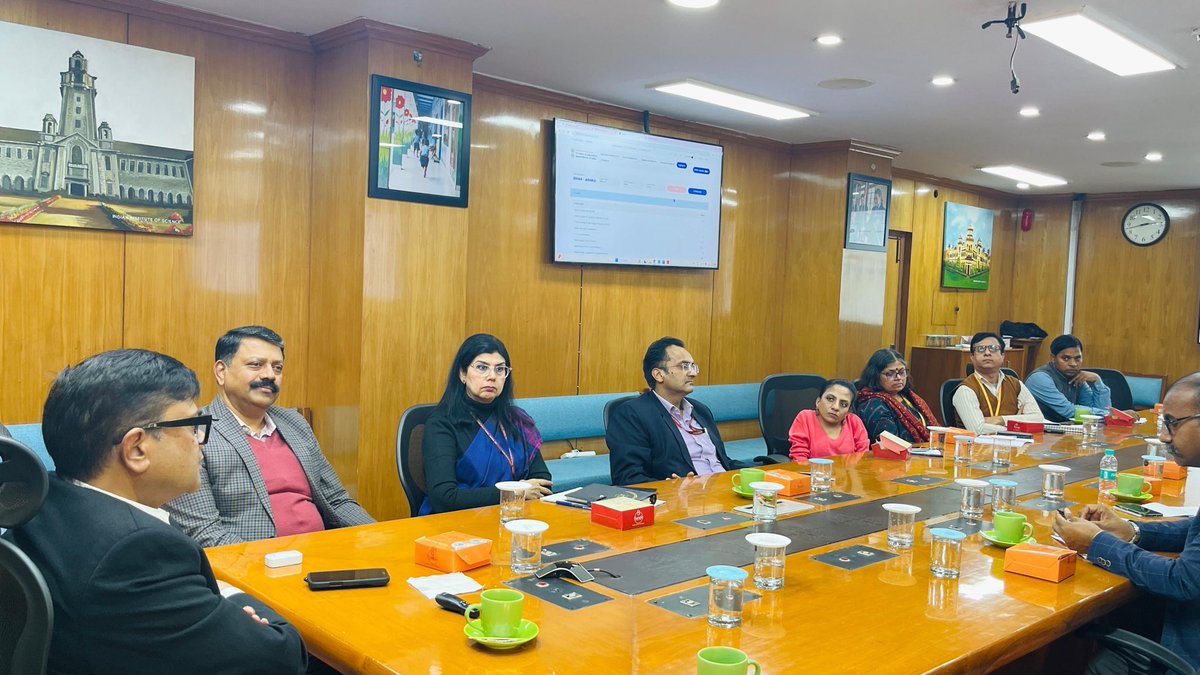
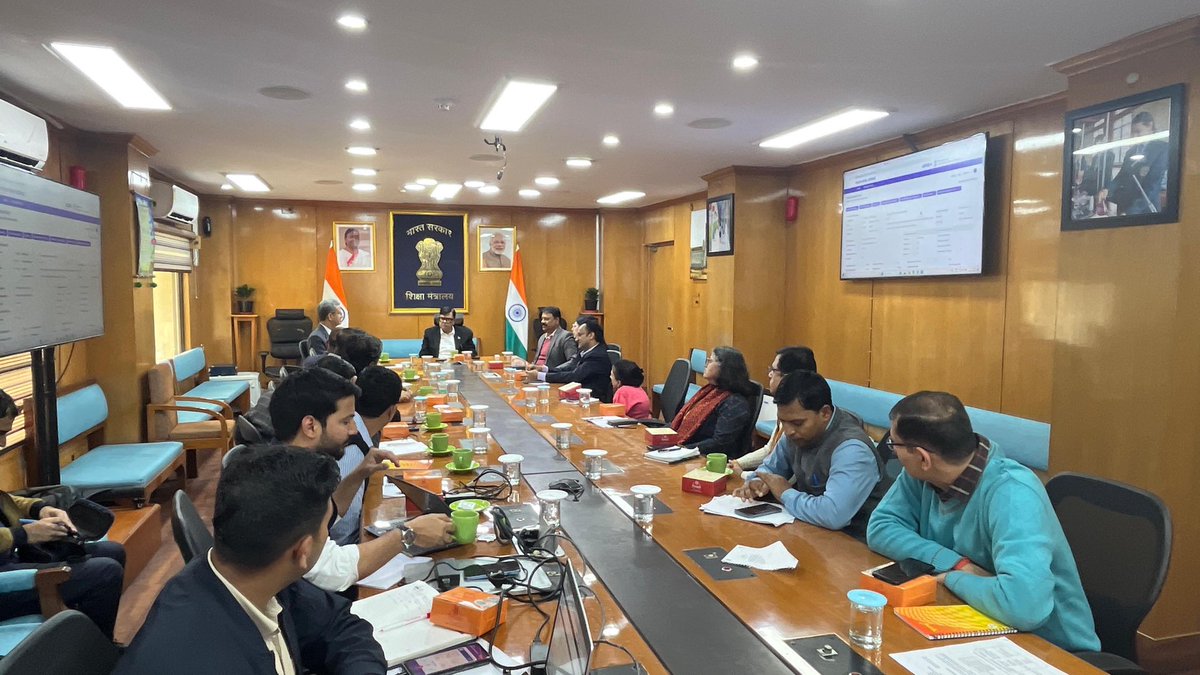
On 2 December 2025, the UDISE Plus related Mobile Apps, namely, “School GIS” and “Know Your School” were launched by Shri Sanjay Kumar, Secretary, Department of School Education and Literacy at Shastri Bhawan. In his address, Shri @sanjayjavin highlighted the significance of leveraging technology to provide reliable, real-time information that supports informed decision-making and enhances public engagement with school education data.
The GIS Capture app introduces a geospatial and visual verification layer to UDISE , enabling authorised users to capture accurate school locations along with photographic records of infrastructure. This strengthens data accuracy, transparency, planning, accountability and community trust.
The UDISE Know Your School app provides real-time, verified school information through a user-friendly mobile and web platform. With features such as advanced search and digital report cards, the app enhances transparency and supports informed decision-making for stakeholders across the nation. A demonstration was also given on the updated fact sheet based on UDISE results. During the meeting, senior officials from the Ministry were also present.
#NEP2020 #SchoolEducation #DigitalInnovation #UDISEPlus #SamagraShiksha #DoSEL
3
31
133
8,398
9 Nov 2025
A one-day capacity building workshop was conducted by the Ministry of Education for State officials of UT Ladakh on effective use of UDISE and PRABANDH portals. The session aimed to strengthen data-driven planning, monitoring & implementation of Samagra Shiksha interventions to enhance school education outcomes.
Attended by Secretary Education Ms. Bhanu Prabha, ASPD Ms. Tashi Dolma & ~120 district, zonal & school officials.
#SamagraShiksha #UDISEPlus #PRABANDH #SchoolEducation #Ladakh

6
17
73
9,214

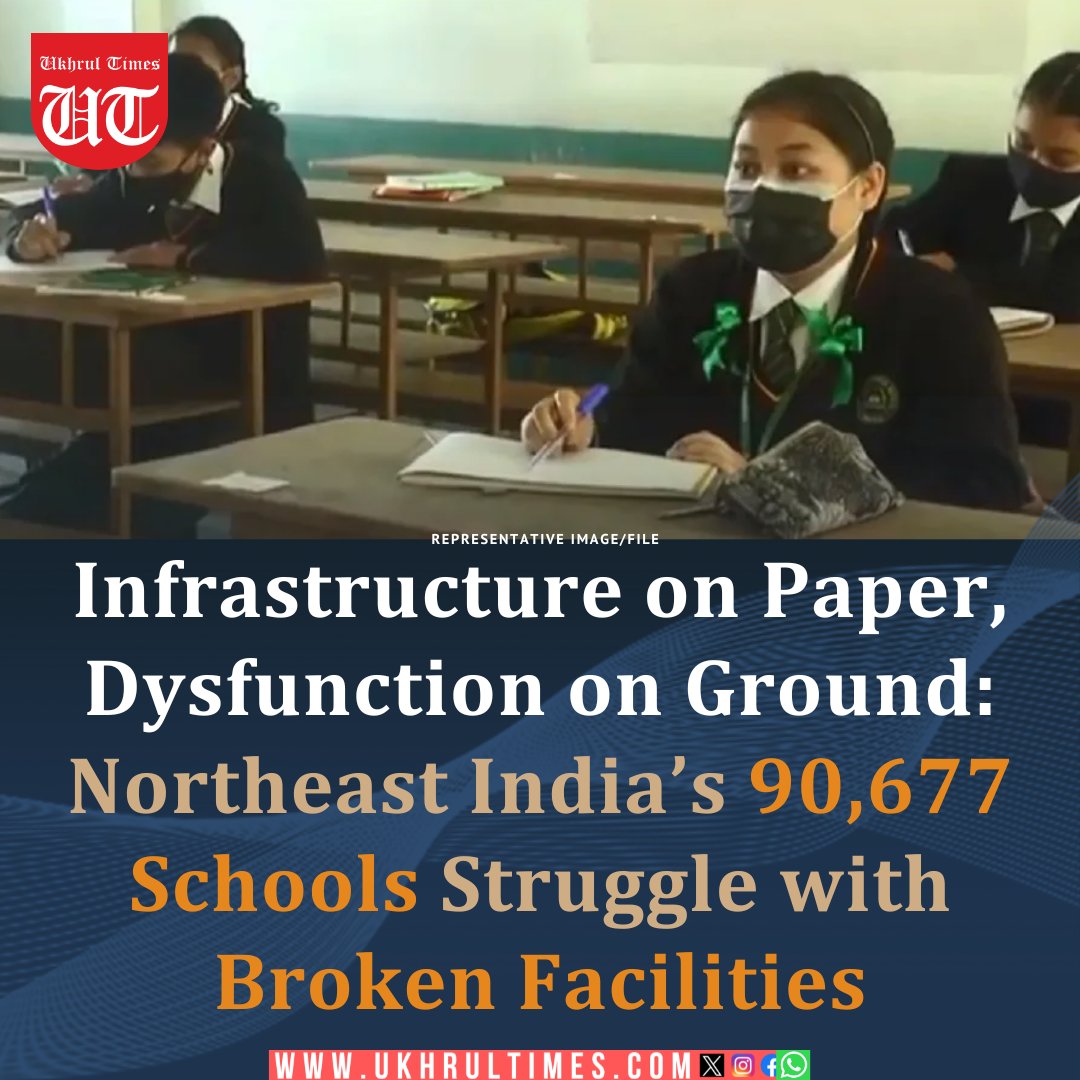
30 Oct 2025
Over 1 crore students in the #NortheastIndia are facing a stark reality: 31,024 schools lack basic power & 5,078 girls' toilets are unusable! UDISE 2024-25 data reveal a critical failure in functional infrastructure and a massive digital divide. #NortheastEducationCrisis #UDISEPlus #SchoolInfrastructure #FunctionalToilets #NoElectricity
Read the full report on the region's education crisis: ukhrultimes.com/northeast-sc…
1
5
11
698

11 Sep 2025
📊 A 2-Day Divisional Workshop on #UDISEPlus 2025-26 was organized by @SamagraJK under the guidance of Project Director, Mr. Bhawani Rakwal.
Focused on strengthening data collection, analysis & reporting for better educational planning in J&K. 🌱
2
16
492


1 Sep 2025
Deeply inspiring. Big congratulations to Safeena Husain and her team.
In India, around 2.5 to 3 million girls drop out of school every year, with girls accounting for about 46% of all school dropouts at the elementary level according to UDISEPlus data for 2023-24

2
49
180
6,535
28 Aug 2025
UDISE 2024–25 Report Released!
India’s school education system has achieved major milestones this year. For the first time, the number of teachers has crossed the 1 crore mark, strengthening quality education and significantly improved pupil-teacher ratios. Dropout rates have declined sharply at the Preparatory, Middle and Secondary levels, while retention has improved across all stages.
Girls’ enrolment has risen to 48.3% and women now form 54.2% of the teaching workforce. Infrastructure too has seen a big boost with 99.3% schools having drinking water, 97.3% girls’ toilets, 95.9% handwash facilities, 64.7% schools now equipped with computers and 63.5% with internet access.
The number of single-teacher and zero-enrolment schools has also dropped significantly, ensuring stronger, inclusive, and tech-enabled learning environments for students.
Read more ➡️pib.gov.in/PressReleasePage.…
🔗Visit udiseplus.gov.in/ for more
#UDISEPlus #SchoolEducation #NEP2020 #EducationForAll
@narendramodi @PMOIndia @dpradhanbjp @sanjayjavin @PIB_India @PIB_Edu @airnewsalerts @DDNewslive
4
24
78
10,633

28 Aug 2025
SHVR पोर्टल पर स्कूल रजिस्ट्रेशन और सर्वे प्रक्रिया | पूरी जानकारी हिंदी में
वीडियो विवरण
"इस वीडियो में हम बताएंगे कि कैसे आप SHVR (Swachh Evam Harit Vidyalaya Rating) पोर्टल पर अपने स्कूल का रजिस्ट्रेशन और सर्वे प्रक्रिया पूरी कर सकते हैं। इस वीडियो में UDISE कोड से रजिस्ट्रेशन, मोबाइल OTP सत्यापन, स्कूल प्रोफाइल फॉर्म फिलिंग, 60 संकेतकों के सर्वे, फोटो अपलोड, जियो-टैगिंग और ऑनलाइन/ऑफलाइन डेटा एंट्री के बारे में विस्तार से समझाया गया है। सभी सरकारी, निजी, आवासीय, केन्द्रीय, ट्राईबल और CBSE स्कूलों के लिए SHVR प्रक्रिया जरूरी है। अपनी स्कूल की हरित और स्वच्छता रेटिंग बढ़ाने के लिए यह वीडियो जरूर देखें और SHVR पोर्टल पर समय रहते अपनी रजिस्ट्रेशन एवं सर्वे प्रक्रिया पूरी करें।
आवश्यक लिंक:
SHVR पोर्टल: shvr.education.gov.in/
अंतिम तिथि: 30 सितंबर 2025
संबंधित जानकारी, FAQs और समस्या समाधान के टिप्स भी दिए गए हैं।
पूरा वीडियो देखें और अपने विद्यालय की रैंकिंग बढ़ाएं!"
हैशटैग
#SHVR #SchoolRegistration #HaritVidyalaya #SwachhVidyalaya #UDISEplus #EducationPortal #SchoolSurvey #CBSE #SchoolAdmin #सर्वे #शिक्षा #HindiTutorial #DigitalSchool #CleanAndGreenSchool #कर्मयोगीभारत
2
177

आज शिक्षा विभाग की योजनाओं को लेकर जिला स्तरीय समीक्षा बैठक आयोजित हुई।
RAIL टेस्ट,e-विद्या वाहिनी,SMC बैठक, UDISE अपडेट व वार्षिक परिणामों की समीक्षा की गई।
एक कोर टीम गठन कर शिक्षकों से संवाद व प्रगति अनुश्रवण का निर्देश।
#EducationReview #RAILTest #UDISEPlus #EVidyaVahini
4
17
636

12 Mar 2025
Tamil Nadu leads with a GER of 47% in 2021-22, nearly double the national average of 28.4% (AISHE) 2021-22 (GER Data).
Uttar Pradesh, however, lags with a GER of approximately 24.1% in 2021, indicating lower participation rates, possibly due to socio-economic barriers and infrastructure limitations.
Pupil-Teacher Ratio and School Infra :
The pupil-teacher ratio (PTR) is crucial for educational quality.
UDISEPlus 2021-22 suggests Tamil Nadu maintains a more favorable PTR, with efforts to meet the Right to Education Act's norms of 30:1 for primary and 35:1 for upper primary levels.
Uttar Pradesh, with 155,756 primary schools and 24,569 secondary schools in 2015, faces challenges in teacher deployment, with reports indicating higher PTRs.
In terms of school numbers, Uttar Pradesh significantly outnumbers Tamil Nadu, with 155,756 primary schools compared to Tamil Nadu's 35,379, and 24,569 secondary schools versus Tamil Nadu's 12,471, as per CEIC data from 2015.
This reflects Uttar Pradesh's larger population but also highlights the strain on resources.
Board Exam Pass Percentages :
Board exam pass percentages offer insight into secondary education outcomes.
Tamil Nadu's Class 12 pass percentage has consistently been around 94%, with 2024 data showing 94.56% (TN Board Exam Results).
Uttar Pradesh, on the other hand, recorded a pass percentage of 89.55% for Class 10 in 2024, with Class 12 typically in the 89-90% range (UP Board Passing Marks).
This gap underscores Tamil Nadu's stronger performance, possibly due to better teaching quality and infrastructure.
Performance in National Tests: NEET and JEE
National tests like NEET and JEE provide a benchmark for competitive exam performance. For NEET 2023, Tamil Nadu had 1,44,516 candidates appear, with 78,693 qualifying, yielding a pass percentage of 54.46%.
Uttar Pradesh, with 2,67,383 appearing and 1,39,961 qualifying, had a pass percentage of 52.34%, but its absolute numbers are higher due to a larger candidate pool (NEET 2023 Statistics).
This indicates Tamil Nadu's higher efficiency in qualifying candidates, despite opposition to NEET, reflecting robust coaching and preparation systems.
For JEE Main, state-wise qualifier data is less readily available, but given Uttar Pradesh's larger student base, it likely has more qualifiers in absolute terms.
Tamil Nadu, however, may show higher pass percentages, aligning with its educational strengths.
Government Policies and Reforms
Tamil Nadu's education policies, such as the State Education Policy (SEP) and initiatives like the Noon Meal Programme, have historically prioritized access and equity, contributing to its high GER and literacy rates (Tamil Nadu's Education Strategy).
Uttar Pradesh, under the National Education Policy (NEP) 2020, aims to improve GER to 50% by 2035, but faces challenges in implementation due to its size and resource constraints (NEP 2020 Impact).
Comparative Table: Key Metrics
Below is a table summarizing key metrics for comparison:
Metric
Tamil Nadu
Uttar Pradesh
Literacy Rate (2011)
80.33%
67.68%
GER in Higher Education (2021-22)
47%
24.1%
Primary Schools (2015)
35,379
155,756
Secondary Schools (2015)
12,471
24,569
Class 12 Pass Percentage (2024)
94.56%
~89-90%
NEET 2023 Appeared
1,44,516
2,67,383
NEET 2023 Qualified
78,693
1,39,961
NEET 2023 Pass Percentage
54.46%
52.34%
Conclusion :
Tamil Nadu's education system outperforms Uttar Pradesh across most metrics, particularly in literacy, higher education enrollment, and exam pass percentages, driven by proactive policies and better infrastructure.
Uttar Pradesh, while having more schools and qualifiers due to its population, faces challenges in quality and access, necessitating targeted interventions to bridge the gap.
4
21
4,837

5 Mar 2025
Based on the UDISEPlus 2021-22 data, here's a glimpse at some state-wise percentages for digital library availability in schools:
Kerala leads with about 6.8% of government schools having digital libraries.
Punjab follows closely at 6.4%, while Sikkim stands out with approximately 7.3% of government schools equipped with digital libraries.
For private unaided schools, Kerala has about 5.1% with digital libraries, Punjab 6.4%, and Sikkim again leads with 7.3%.
It's worth noting that these percentages vary significantly across states and school types, with many states still working on improving their digital infrastructure in education.
1
30

3 Jan 2025
ಭಾರತದ ಅರ್ಧದಷ್ಟು ಶಾಲೆಗಳಲ್ಲಿ ಕಂಪ್ಯೂಟರ್ ಇಲ್ಲ; AI ಯುಗದಲ್ಲಿ ಮಕ್ಕಳ ಶಿಕ್ಷಣ ಕುರಿತು UDISE 2023-24 ಆಘಾತಕಾರಿ ವರದಿ!
#AIart #udiseplus #ArtificialInteligence #education #india
kannada.asianetnews.com/indi…
1
4
387

29 Jul 2024
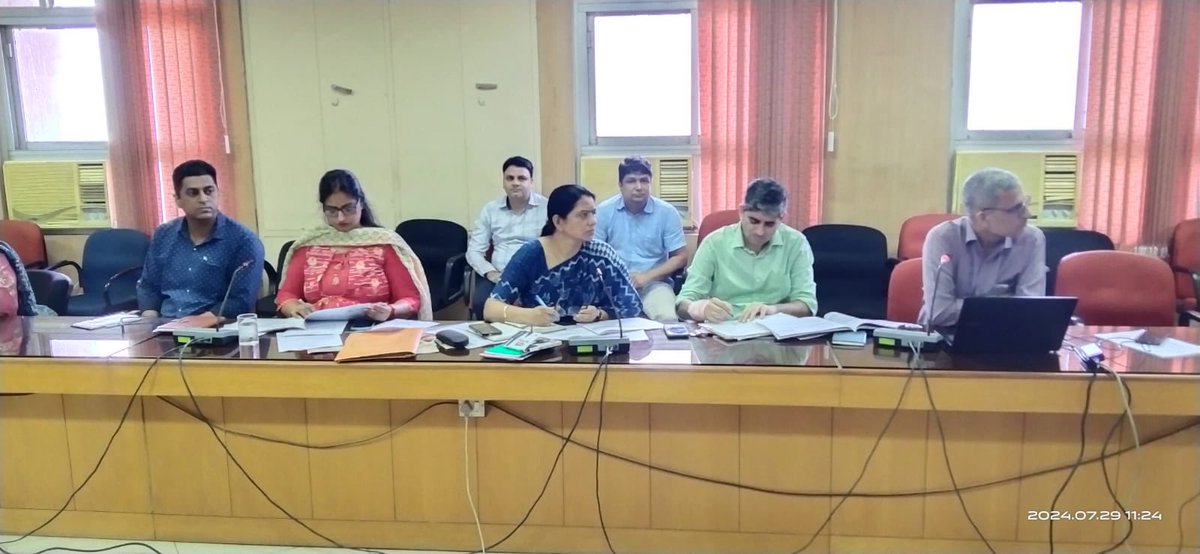
समीक्षा बैठक
यूडाईस प्लस के डाटा का नियमित अपडेशन सुनिश्चित करें -शासन सचिव स्कूल शिक्षा
शासन सचिव, स्कूल शिक्षा श्री कृष्ण कुणाल ने कहा कि भारत सरकार द्वारा संचालित यूडाईस प्लस पोर्टल पर राजकीय एवं निजी विद्यालयों से संबंधित डाटा का नियमित रूप से अपडेशन सुनिश्चित करें।
श्री कुणाल सोमवार को स्कूल शिक्षा परिषद् में यूडाइस प्लस पोर्टल से जुड़े विभागों की समीक्षा बैठक को संबोधित कर रहे थे।
उन्होंने बताया कि यूडाइस प्लस पोर्टल पर प्रत्येक विद्यार्थी का परमानेंट एज्यूकेशन नम्बर (पी.ई.एन.) सृजित किया जा रहा है. जो विद्यार्थी की यूनिक आईडी होगी एवं प्रत्येक विद्यार्थी के स्थानान्तरण प्रमाण पत्र पर अनिवार्य रूप से अंकित किया जाएगा। शालादर्पण एवं पीएसपी पोर्टल पर अपलोड किये गये डाटा को यूडाइस प्लस पोर्टल से समन्वित किया जावे। जिससे दोहराव एवं डाटा की भिन्नता की स्थिति से बचा जा सके।
बैठक में निदेशक माध्यमिक माध्यमिक शिक्षा श्री आशीष मोदी, विशिष्ट शासन सचिव, श्रीमती चित्रा गुप्ता तथा महिला बाल विकास, जनजातीय क्षेत्रीय विकास मदरसा बोर्ड, सामाजिक न्याय एवं आधिकारिता विभाग, संस्कृत शिक्षासहित शिक्षा विभाग के अधिकारी उपस्थित रहे।
#education #rajasthan #udiseplus #SMSA #RCSE

1
3
45
3,971

29 Apr 2023
मान्यता बचानी है तो udiseplus पोर्टल पर अपलोड करवाएं विद्यालय और छात्रों की जानकारी theliveink.com/If-recognitio…
#यूडायसपोर्टल #भदोही #समाचार #Bhadohi #BSA #BEO #udiseplus #Portal @bhadohi_bsa @basicshiksha_up @DBE_SA
1
2
50

9 Feb 2023
Best Video in Hindi about UDISE PLUS 2022
#udiseplus
#sdmsportal
#studentportal
youtu.be/gRnflwbvWiI

2
146

26 Jul 2021
பள்ளிகளுக்கான கணினி, இணைய வசதியில் 'நகரும்' டிஜிட்டல் இந்தியா: UDISE ஆய்வறிக்கை பகுதி - 4 bit.ly/3kV44Tp
#PTDataStory | #PTinfographics | #UDISEplus | #UDISEplusReport | #SchoolEducation | #SchoolsInIndia | #SchoolsInTamilNadu
2
8