
9 Dec 2025
Data Profiling — Having that First Date with your Data: medium.com/codex/data-profil…
——————
#BI #Analytics #DataScience #MachineLearning #Statistics #DataAnalytics #DataLiteracy #DataViz #VisualAnalytics #DataStorytelling #DataScientist #ExploratoryDataAnalysis

11
67
4,166

1 Dec 2025
In a world obsessed with "AI Everything," we’ve forgotten the most critical step: actually seeing the data before the model takes over. 🔍
We are drowning in black-box architectures, yet we still struggle to answer basic questions about categorical data without force-fitting a regression line.
If your data isn't continuous numbers, if it's ratings, rankings, or survey responses, standard correlation (Pearson’s r) is lying to you. And jumping straight to a Logistic Regression is just guessing the architecture before you've looked at the blueprints.
We need to stop "modeling" exploration. We need model-free truth first.
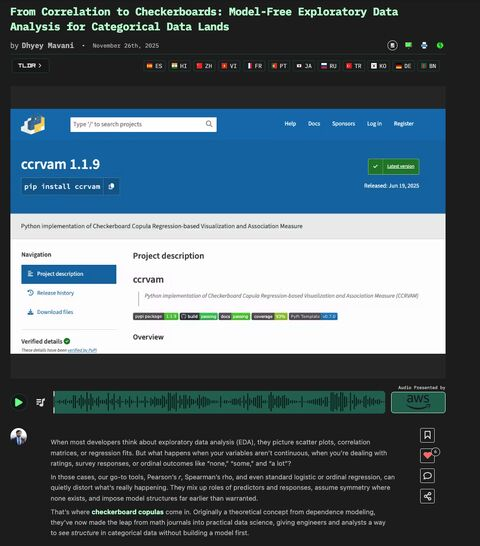
I just published a deep dive on HackerNoon about Checkerboard Copula Regression (CCR).
It bridges the gap between raw data and complex AI. Instead of assuming a shape (like a line or a bell curve), it cuts the data into a "checkerboard" grid to reveal the actual dependence structure: unbiased and transparent.
The result?
> 𝐍𝐨 𝐚𝐬𝐬𝐮𝐦𝐩𝐭𝐢𝐨𝐧𝐬: It works on the data you have, not the distribution you wish you had.
> 𝐑𝐞𝐚𝐥 𝐢𝐧𝐭𝐞𝐫𝐩𝐫𝐞𝐭𝐚𝐛𝐢𝐥𝐢𝐭𝐲: It gives you an R^2-like score for categorical data that actually makes sense.
> 𝐀𝐮𝐝𝐢𝐭𝐚𝐛𝐢𝐥𝐢𝐭𝐲: It creates a "clear box" before you build the "black box."
We even released an open-source Python package (ccrvam) so you can test it yourself. 𝐃𝐨𝐰𝐧𝐥𝐨𝐚𝐝𝐞𝐝 𝐨𝐯𝐞𝐫 24,000 𝐭𝐢𝐦𝐞𝐬 𝐬𝐨 𝐟𝐚𝐫.
Stop letting the model tell you what the data says. See it for yourself first.
Full @hackernoon article: hackernoon.com/from-correlat…
More detailed explanation about the method can be found in my 120-page statistics thesis: dhyeymavani.com/publication/…
If you're more of a visual learner, here's my thesis defense slides: dhyeymavani.com/media/amhers…
#DataScience #AI #Statistics #ModelFree #ExploratoryDataAnalysis #Python
1
2
112

30 Nov 2025
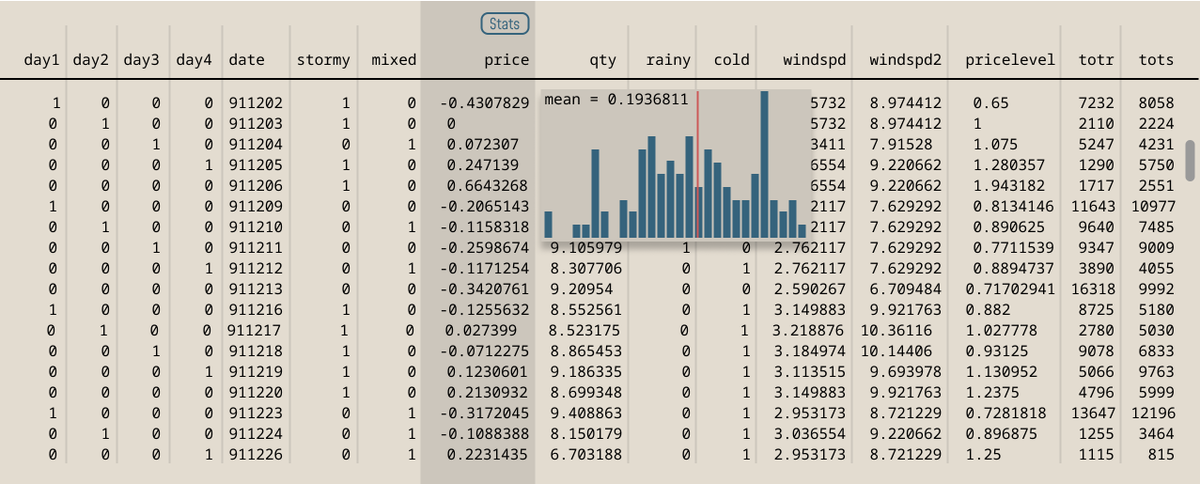
1/3 Exploratory data analysis is usually where the first real insight appears. I’ve been looking for ways to make that moment clearer and more immediate. #DataVisualization #ExploratoryDataAnalysis #UXDesign #InformationDesign
1
5
41

13 Aug 2025
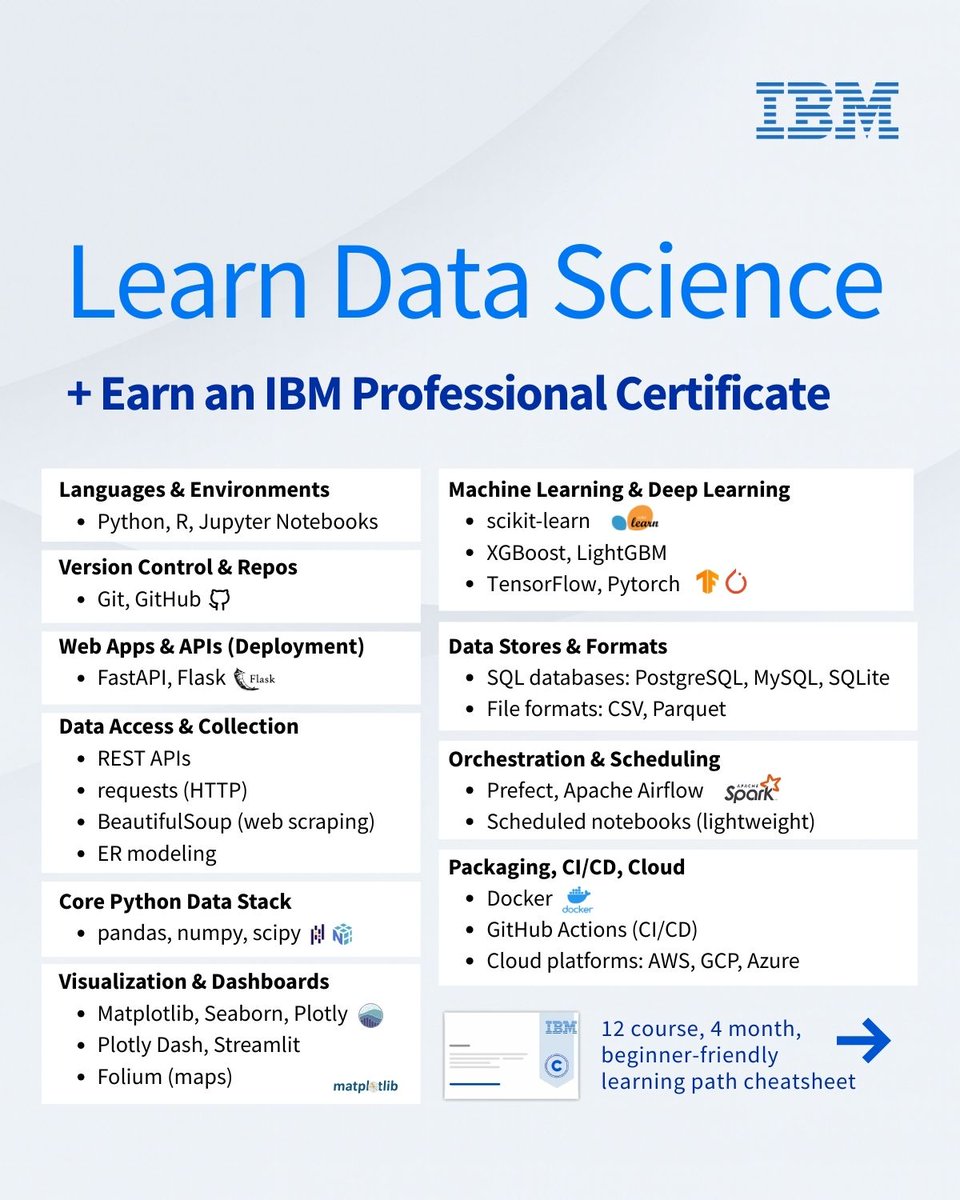
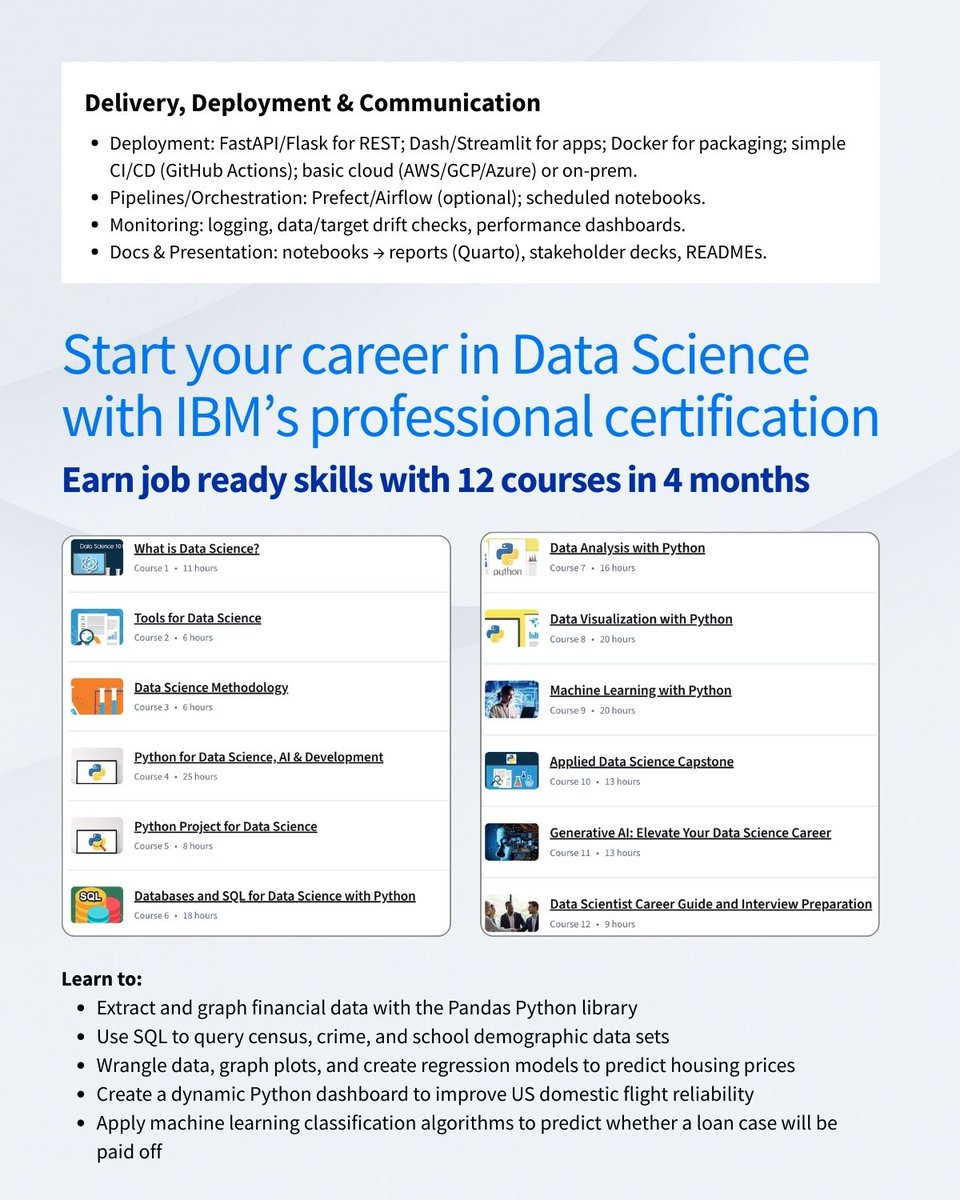
Learn in-demand Data Science skills with IBM's Professional Certification. Beginner-friendly, 4-month, 12-course learning path to become job-ready ⬇️
Gain experience with databases, data visualization, statistical analysis, predictive modeling, machine learning algorithms, and data mining.
You’ll also work with the latest languages, tools,and libraries including Python, SQL, Jupyter notebooks, Github, Rstudio, Pandas, Numpy, ScikitLearn, Matplotlib, and more.
Plus, go through hands-on labs in the IBM Cloud; extract & chart financial data with Pandas; query public datasets with SQL, and build a Python dashboard.
Finally, apply generative AI tools and techniques and workflow automation.
Start your Data Science career with IBM, Enrol now:
🔗 ibm.biz/Bdefhn
#DataScience #ExploratoryDataAnalysis #DashboardDesign #AppliedMachineLearning #DataVisualization #CareerGrowth #ProfessionalNetworking
1
8
268

Anticipate💙...
Project in Progress🚀..
#dataanalysis #excel #amazon #arrayfunction #nopivottables #techsis #MuslimahInTech #data #exploratorydataanalysis
1
45

26 Dec 2024
My second data book for the year arrived today💃.
Thank you so much, @GiftOjeabulu_ and Ayodele Oluleye,for making this possible🤗.
In the meantime,I'll be in the kitchen with my new cookbook📚. Happy Boxing Day to you☺️!
#DataScience
#ExploratoryDataAnalysis
#CookBook
#Python
2
2
13
661

18 Nov 2024
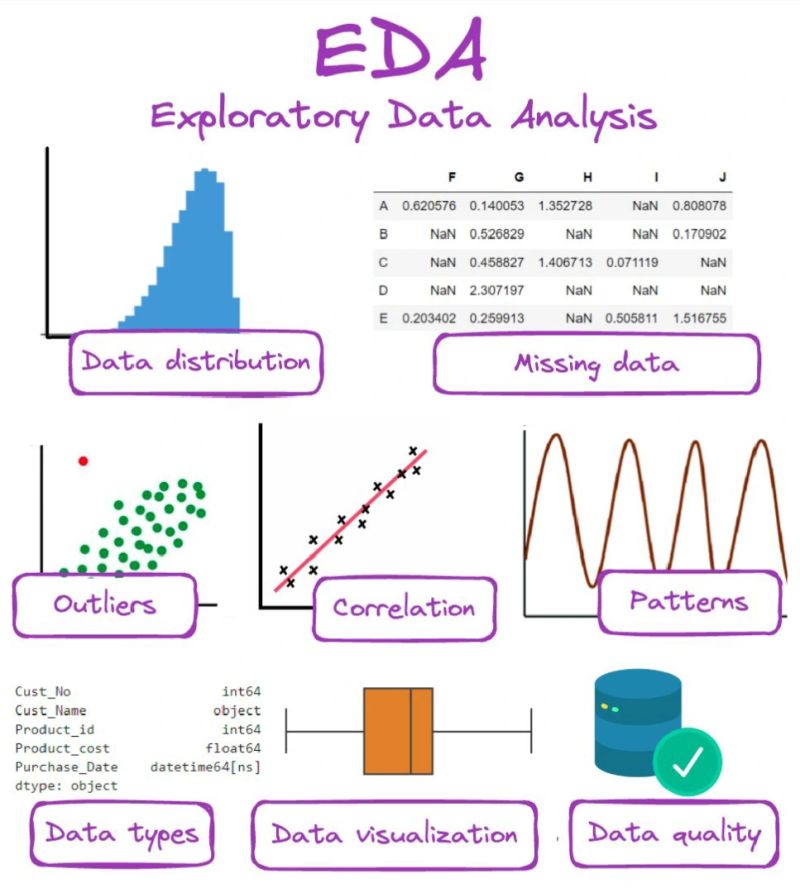
A few days ago, I made a post about why EDA is important in data analytics and I feel I should tell you some more benefits of EDA.
EDA stands for Exploratory Data Analysis and you perform basic and high-level analysis in EDA to have a better understanding of the data.
𝗜𝘁 𝗵𝗮𝘀 𝘃𝗮𝗿𝗶𝗼𝘂𝘀 𝗯𝗲𝗻𝗲𝗳𝗶𝘁𝘀 𝘀𝘂𝗰𝗵 𝗮𝘀:
• So, I also posted how to select relevant variables according to your business problems when your datasets are massive. EDA helps in that too.
• EDA also allows you to shop for KPIs or metrics when you are familiarizing yourself with the data.
• It can also allow you to flag some anomalies in the data because sometimes crucial data points can be missing. If you spend enough time in EDA, you can notice it and thus solve it.
So, always perform EDA as a data analyst. Never skip it.
Enjoy. Follow for more!
#ExploratoryDataAnalysis #DataAnalytics #DataScience #DataAnalyst #DataExploration #EDABenefits #Analytics #DataAnalysis #BusinessIntelligence #DataDrivenDecisionMaking #DataAnalyticsUSA #USDataAnalyst #DataScienceUSA #USAnalyticsJobs #DataDrivenUSA #DataAnalyticsUK #UKDataAnalyst #DataScienceUK #AnalyticsCareersUK #BusinessIntelligenceUK #DataAnalyticsEurope #EUDataAnalyst #DataScienceEurope #EuropeanAnalytics #DataJobsEurope #DataAnalyticsSG #SingaporeDataAnalyst #SGDataScience #AnalyticsJobsSG #SingaporeAnalytics #DataAnalytics #GlobalDataAnalyst #DataScienceCommunity #DataDriven #AnalyticsCareersWorldwide
2
28
14 Nov 2024
𝗔𝘀 𝗮 𝗱𝗮𝘁𝗮 𝗮𝗻𝗮𝗹𝘆𝘀𝘁, 𝗮𝗹𝘄𝗮𝘆𝘀 𝘀𝗽𝗲𝗻𝗱 𝗲𝗻𝗼𝘂𝗴𝗵 𝘁𝗶𝗺𝗲 𝗽𝗲𝗿𝗳𝗼𝗿𝗺𝗶𝗻𝗴 𝗘𝗗𝗔 𝗮𝘀 👇
Follow for more!
#DataAnalyst #DataAnalytics #ExploratoryDataAnalysis #EDATips #DataScience #BusinessIntelligence #AnalyticsInsights #DataTrends #USDataAnalytics #UKDataAnalytics #EuropeDataCommunity #DataScienceUK #DataScienceUSA #GlobalAnalytics #DataAnalystLife #DataDriven #AnalyticsJobs #EDABestPractices #DataQuality #AnalyticsProfessionals #UKHiring #USEmployment #DataJobsEurope #DataCareersWorldwide #TechCareers #AnalyticsCommunity #DataAnalysisUSA #HiringDataAnalysts #DataScienceCommunity
1
2
30

29 Oct 2024
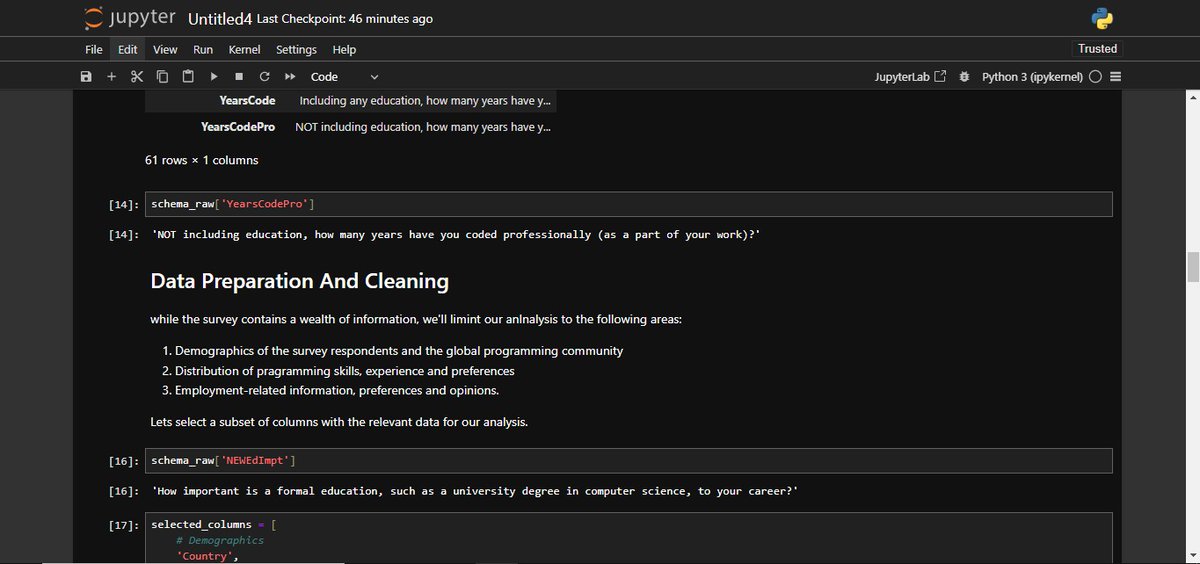
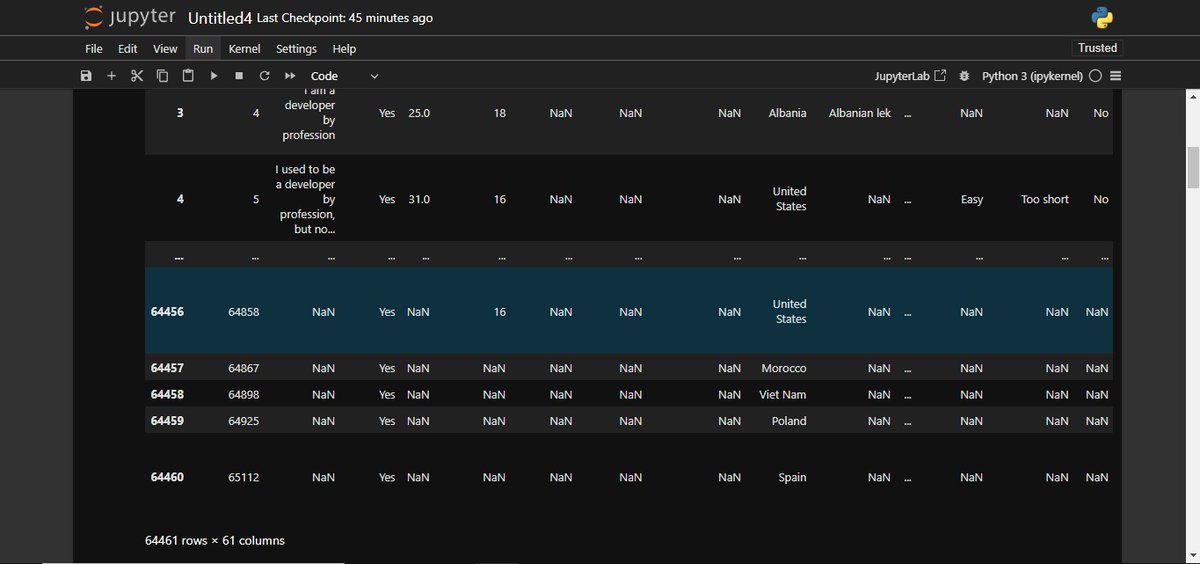
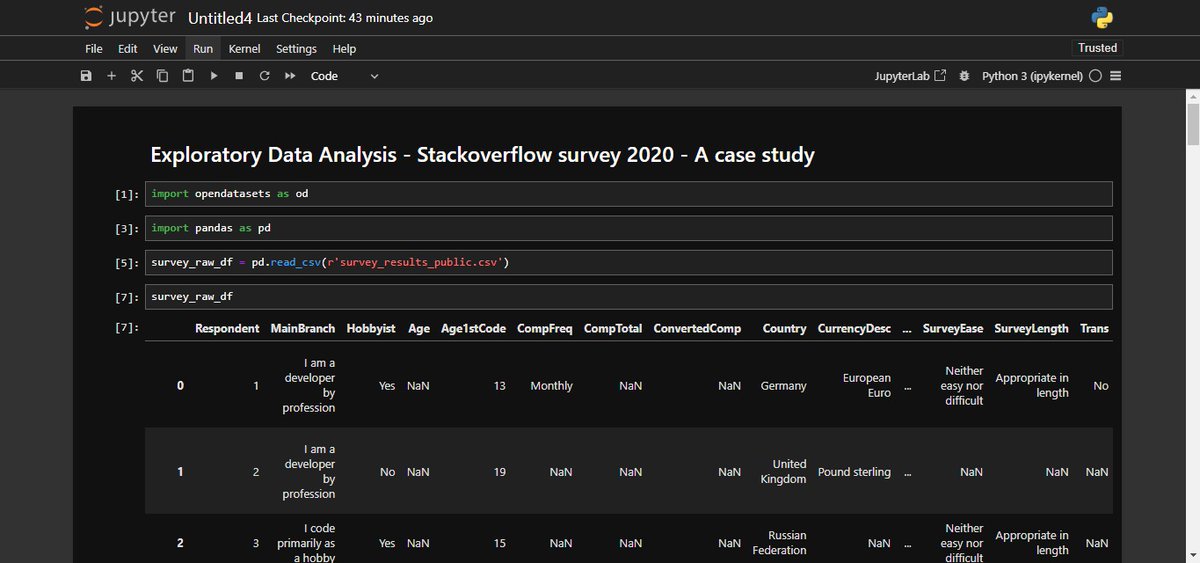
Road to AI/ML. (Week 15)
Exploratory Data Analysis (EDA) - Part 1- StackOverflow survey 2020 -A case study.
#Python #AdvancePython #AI #Artificialintelligence #MachineLearning #DataScientist #DeepLearning #DataEngineer #Documentary #DataAnalysis #Exploratorydataanalysis

1
2
2
137

22 Sep 2024
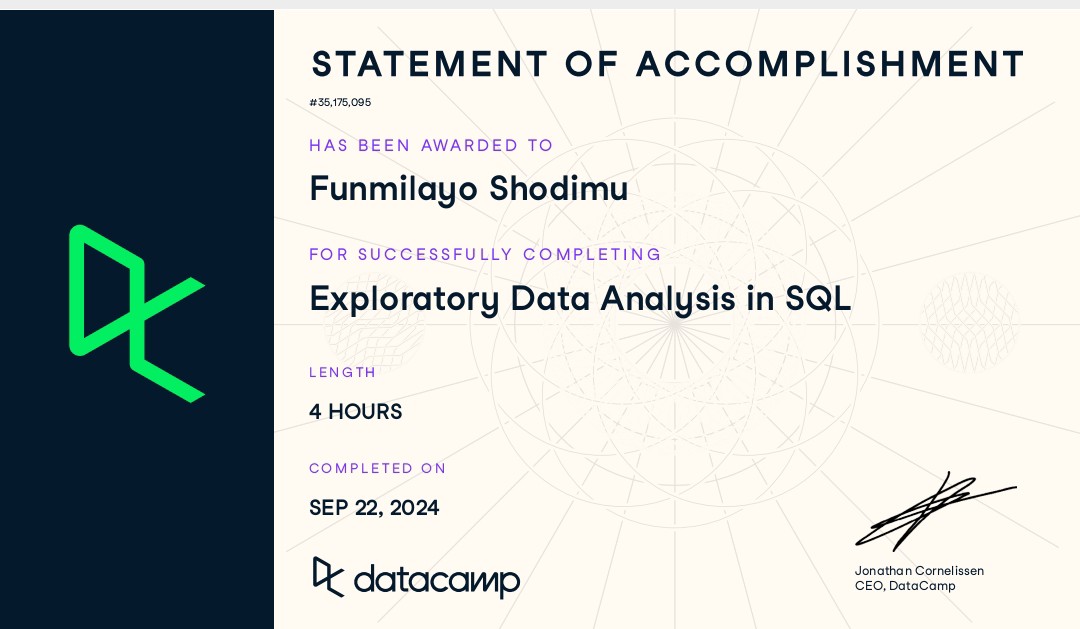
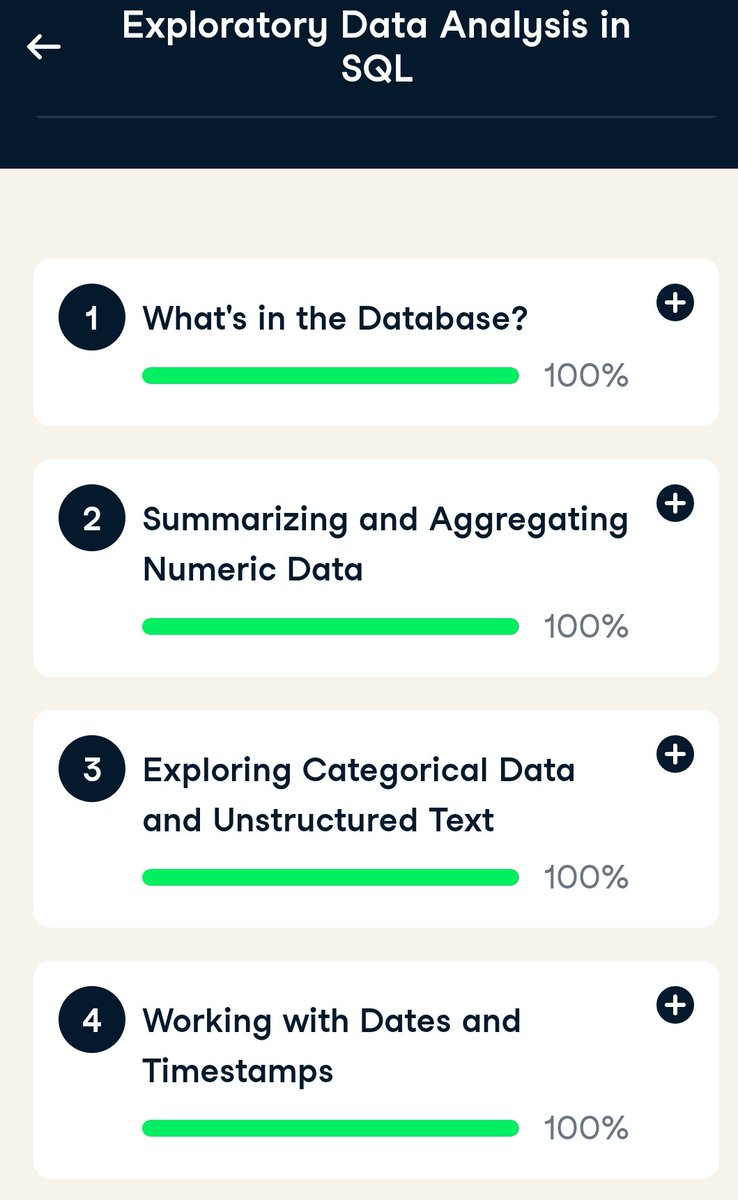
Excited to earn a statement of acomplishmnt on #DataCamp,showcasn my dedication to continuous learning in #DataAnalysis.Completn the ExploratoryDataAnalysis in #SQL course was chalenging but rewarding.The skils gained wil enhance my ability to uncover actionable insights frm data
1
11
1,742
22 Sep 2024
Excited to earn a statement of acomplishmnt on #DataCamp,showcasn my dedication to continuous learning in #DataAnalysis.Completn the ExploratoryDataAnalysis in #SQL course was chalenging but rewarding.The skils gained wil enhance my ability to uncover actionable insights frm data


2
4
116

20 Jun 2024
📊Analyzing forest fires in Algeria! 🇩🇿 The dataset includes weather observations, FWI components, and two classes: fire and not fire. 🌡️🌧️ Dive into the #EDA :
#DataScience #DataAnalysis #ExploratoryDataAnalysis
1
2
51

5 Jun 2024
Don't settle for surface-level data! #ExploratoryDataAnalysis (#EDA) helps you delve deeper. Make informed decisions fueled by a comprehensive understanding of your data. Let's get started with your free EDA! #BigData #DataAnalysis #DataScience #NLP #ML 515tech.com/contact
2
50

3 Apr 2024
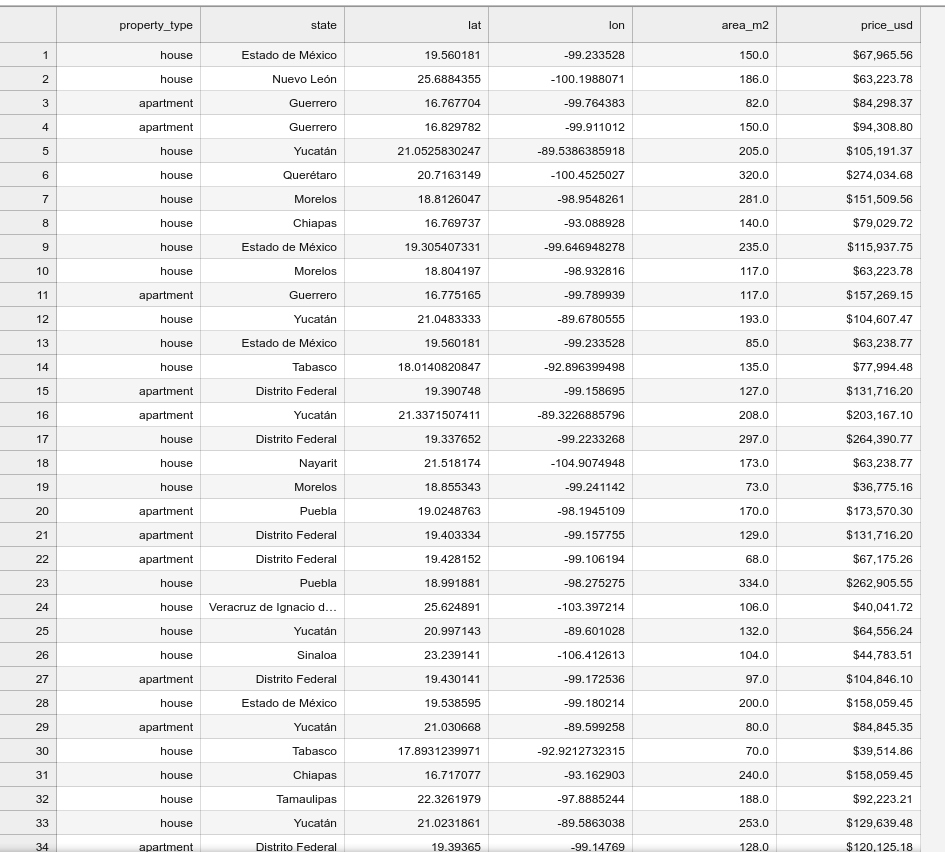
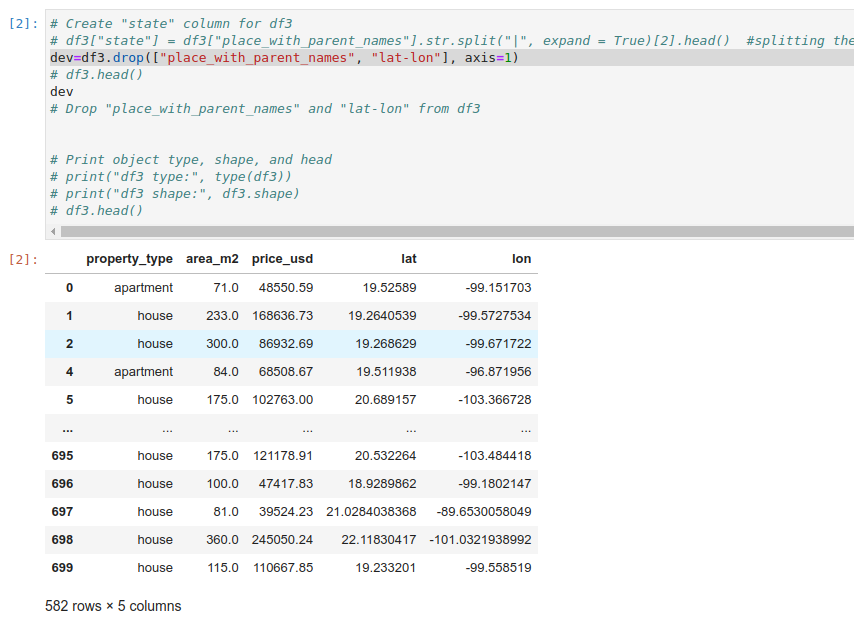
Day 5 of #100DaysOfStudyingDataScience
learned how to remove unwanted columns
dev = df3.drop(["place_with_parent_names", "lat-lon"], axis=1)
then merge my 3 datasets into one datasets and ready for EDA
#DataScience #ExploratoryDataAnalysis #Python #100DaysOfCode #ZiloTech
2
28

17 Feb 2024
Simple but powerful interactive data analysis in R with R/LinekdCharts. #ExploratoryDataAnalysis @GenomeBiology
genomebiology.biomedcentral.…
15
48
3,589

6 Jan 2024
Data Profiling — Having that First Date with your Data: medium.com/codex/data-profil…
——————
#BigData #BI #Analytics #DataScience #MachineLearning #Statistics #DataAnalytics #DataLiteracy #DataViz #VisualAnalytics #DataStorytelling #DataScientists #ExploratoryDataAnalysis

4
99
424
30,416

31 Dec 2023
🧠 An overview of Exploratory Data Analysis for data-driven insights: hubs.la/Q02dHy9D0
#exploratorydataanalysis #dataanalysis #datascience

3
186
639
30,861

14 Dec 2023
TIEC is organizing an online session, “Introduction to Data Analysis,” on December 16 and 17.
t.ly/Vd1KH
#dataanalysis #ExploratoryDataAnalysis #dataprocessing
1
392
10 Dec 2023
🧠 An overview of Exploratory Data Analysis for data-driven insights: hubs.la/Q02bL31Z0
#exploratorydataanalysis #dataanalysis #datascience
1
170
726
48,659