
𝐓𝐡𝐞 𝐁𝐮𝐥𝐥 𝐌𝐚𝐫𝐤𝐞𝐭 𝐒𝐞𝐜𝐫𝐞𝐭 𝐌𝐨𝐬𝐭 𝐓𝐫𝐚𝐝𝐞𝐫𝐬 𝐋𝐞𝐚𝐫𝐧 𝐓𝐨𝐨 𝐋𝐚𝐭𝐞
A strong bull market can make investing feel easy. Stocks rise steadily, confidence grows, and every dip seems to be a buying opportunity. However, the biggest gains are often made not by predicting the future but by understanding the characteristics of a powerful uptrend and positioning yourself correctly. Many traders get trapped by chasing momentum too late or selling too early. The real edge comes from recognizing the structure of a healthy trend. One of the simplest yet most effective ways to identify a strong bullish market is by studying the relationship between the 20 Moving Average and the 50 Moving Average. These two moving averages act like the heartbeat of a trend. When they align correctly, they reveal whether institutions are aggressively accumulating stocks or whether the market is beginning to weaken. Traders who understand these signals can stay with winning trends longer, avoid unnecessary exits, and dramatically improve their risk reward profile. The following principles provide a clear framework for identifying high probability bullish environments and maximizing opportunities while controlling risk.
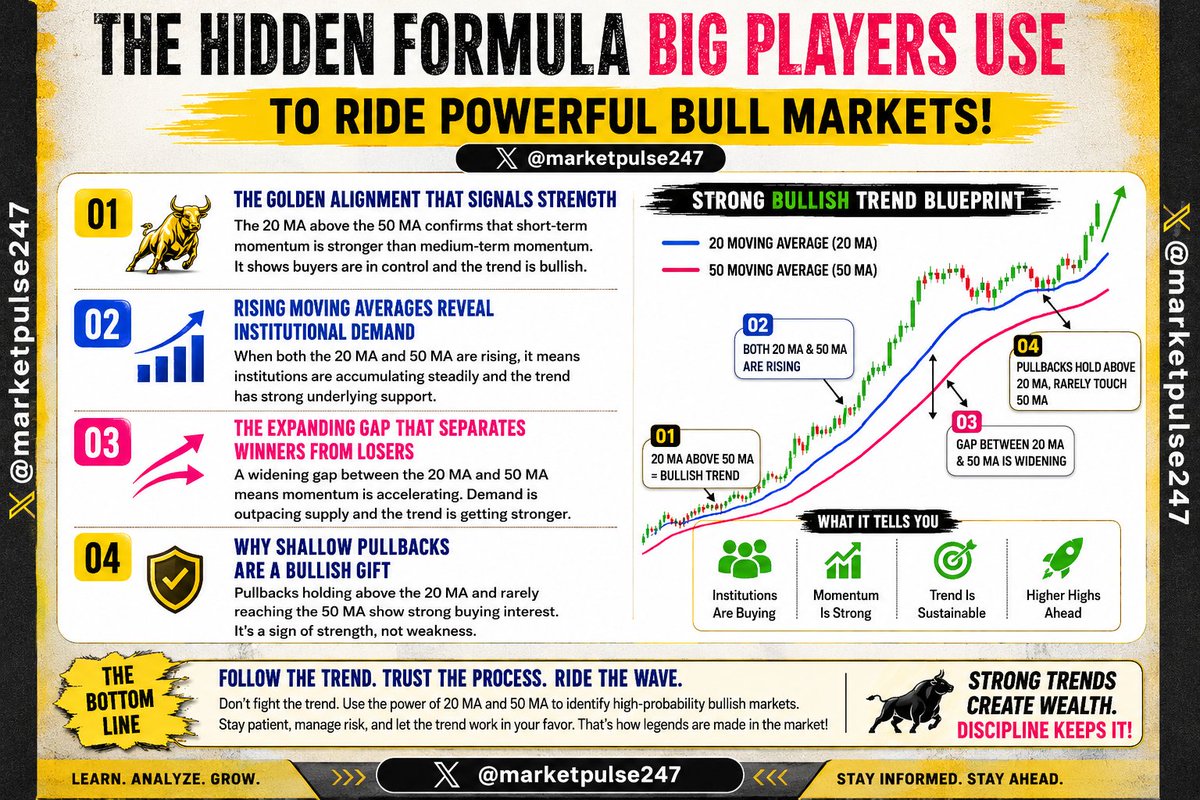
𝟏. 𝐓𝐡𝐞 𝐆𝐨𝐥𝐝𝐞𝐧 𝐀𝐥𝐢𝐠𝐧𝐦𝐞𝐧𝐭 𝐓𝐡𝐚𝐭 𝐒𝐢𝐠𝐧𝐚𝐥𝐬 𝐒𝐭𝐫𝐞𝐧𝐠𝐭𝐡
The first sign of a powerful bull market is when the 20 Moving Average remains above the 50 Moving Average. This simple relationship tells us that short term momentum is stronger than medium term momentum. When buyers consistently push prices higher, the faster moving average naturally stays above the slower one. This is often referred to as trend confirmation. In strong bull phases, institutions continuously accumulate shares, causing demand to exceed supply. As a result, prices continue to climb while the moving averages maintain their bullish alignment. Many traders make the mistake of focusing only on price action while ignoring trend structure. A stock can appear expensive, yet continue rising for months because the underlying trend remains healthy. The 20 above the 50 is not just a technical signal; it reflects market psychology. It shows that investors are willing to pay increasingly higher prices. Before considering any bullish trade, always verify this relationship. It acts as the foundation of trend following strategies. When this alignment disappears, it often serves as an early warning that momentum is weakening and greater caution is required.
𝟐. 𝐑𝐢𝐬𝐢𝐧𝐠 𝐌𝐨𝐯𝐢𝐧𝐠 𝐀𝐯𝐞𝐫𝐚𝐠𝐞𝐬 𝐑𝐞𝐯𝐞𝐚𝐥 𝐈𝐧𝐬𝐭𝐢𝐭𝐮𝐭𝐢𝐨𝐧𝐚𝐥 𝐃𝐞𝐦𝐚𝐧𝐝
Having the 20 Moving Average above the 50 Moving Average is important, but it is not enough. Both moving averages should also be rising. This confirms that the trend is not merely bullish but actively strengthening. Rising moving averages indicate that recent prices are consistently higher than older prices. This usually happens when large institutions, mutual funds, and professional investors are steadily accumulating positions. Markets rarely move higher in a straight line. Instead, they advance through a series of rallies and pullbacks. When both moving averages continue to slope upward despite these fluctuations, it demonstrates underlying demand. Traders should pay close attention to the angle of ascent. A steadily rising structure often reflects sustainable growth, while a flattening average can indicate slowing momentum. The greatest market leaders throughout history displayed this characteristic during their strongest advances. Instead of reacting emotionally to short term volatility, traders can use rising moving averages as an objective measure of trend health. This approach helps eliminate noise and keeps attention focused on the bigger picture where the most significant profits are often generated.
𝟑. 𝐓𝐡𝐞 𝐄𝐱𝐩𝐚𝐧𝐝𝐢𝐧𝐠 𝐆𝐚𝐩 𝐓𝐡𝐚𝐭 𝐒𝐞𝐩𝐚𝐫𝐚𝐭𝐞𝐬 𝐖𝐢𝐧𝐧𝐞𝐫𝐬 𝐅𝐫𝐨𝐦 𝐋𝐨𝐬𝐞𝐫𝐬
Another hallmark of a strong bullish trend is a widening distance between the 20 Moving Average and the 50 Moving Average. When the gap expands, it indicates accelerating momentum. Buyers are pushing prices higher at a faster pace than before, causing the shorter moving average to pull away from the longer one. This separation often appears during the most profitable phases of a trend. It reflects urgency among market participants who fear missing out on further gains. However, traders should understand what this widening gap truly means. It is evidence that demand is overwhelming supply. Stocks demonstrating this characteristic often become market leaders because institutions aggressively build positions. Monitoring the distance between the two moving averages provides valuable insight into trend strength. If the gap continues expanding, the bullish trend remains intact. If the gap begins narrowing significantly, it may suggest that momentum is cooling. Successful traders learn to observe these subtle shifts because they frequently signal transitions before they become obvious on the price chart. Understanding this relationship can improve both entry timing and risk management decisions.
𝟒. 𝐖𝐡𝐲 𝐒𝐡𝐚𝐥𝐥𝐨𝐰 𝐏𝐮𝐥𝐥𝐛𝐚𝐜𝐤𝐬 𝐀𝐫𝐞 𝐚 𝐁𝐮𝐥𝐥𝐢𝐬𝐡 𝐆𝐢𝐟𝐭
One of the clearest signs of exceptional strength is when pullbacks stop near the 20 Moving Average and rarely reach the 50 Moving Average. This behavior demonstrates aggressive buying interest. Every time sellers attempt to push prices lower, buyers quickly step in and absorb available supply. As a result, corrections remain shallow and short lived. Many traders fear pullbacks because they view them as weakness. In reality, healthy pullbacks often provide the best entry opportunities in a strong trend. When price repeatedly finds support around the 20 Moving Average, it signals that institutions are defending their positions. This creates a powerful feedback loop where confidence increases and more participants join the trend. The inability of price to reach the 50 Moving Average reveals that sellers lack conviction. Instead of chasing extended rallies, disciplined traders patiently wait for these controlled pullbacks. This strategy allows entries with better risk reward ratios while maintaining alignment with the dominant trend. Understanding the significance of shallow retracements can transform the way traders approach bullish markets and help them participate in larger moves with greater confidence.
𝐂𝐨𝐧𝐜𝐥𝐮𝐬𝐢𝐨𝐧
The strongest bull markets share common characteristics that can be identified long before the majority of traders recognize them. A 20 Moving Average positioned above the 50 Moving Average, both averages rising steadily, an expanding gap between them, and shallow pullbacks that hold above the 50 Moving Average collectively create a blueprint for trend strength. These signals reveal institutional accumulation, growing momentum, and strong investor confidence. Rather than predicting tops or bottoms, successful traders focus on aligning themselves with these objective indicators. The goal is not to trade every market movement but to participate in high probability trends where the odds are clearly in your favor. By studying these simple yet powerful principles, traders can avoid emotional decisions, stay invested during healthy advances, and improve their long term performance. Markets will always experience corrections and periods of uncertainty, but understanding trend structure provides clarity when others are confused. The next time you analyze a chart, look beyond the candles and focus on the relationship between the moving averages. They often tell the real story behind the price action and can become one of the most valuable tools in your trading journey.
Twitter: x.com/@marketpulse247
#BullMarket #StockMarket #Trading #Investing #TechnicalAnalysis #SwingTrading #PositionTrading #MomentumTrading #TrendFollowing #MovingAverage #StockTrading #PriceAction #MarketAnalysis #InvestSmart #TradingStrategy #Investor #StockCharts #MarketTrends #TradingEducation #FinancialFreedom #WealthBuilding #LongTermInvesting #GrowthStocks #BreakoutTrading #RiskManagement #MarketPulse247 #StockTips #TradingPsychology #MoneyManagement #ChartAnalysis #StockMarketIndia #Nifty50 #BankNifty #EquityMarket #InvestmentStrategy #TradingCommunity #MarketInsights #BullishTrend #TrendTrading #SmartInvesting #StockSelection #CapitalGrowth #TraderLife #InvestorsClub #TechnicalTrader #MarketWisdom #StockEducation #FinancialMarkets
1
55

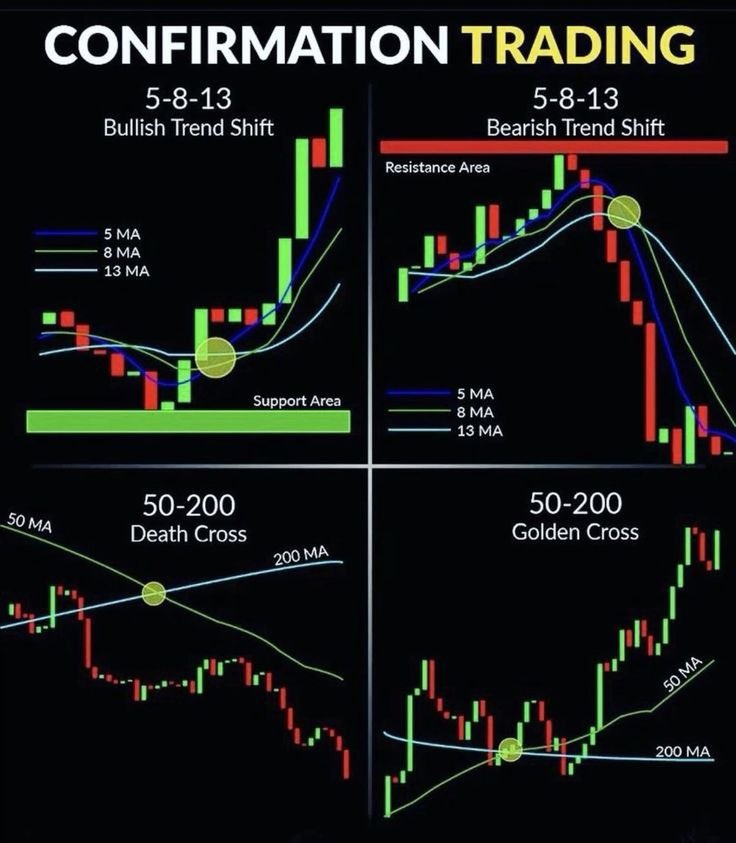
🚨 Most traders chase price… Smart traders wait for confirmation. 📊
✅ 5-8-13 Trend Shift
✅ Golden Cross (50 EMA > 200 EMA)
❌ Death Cross Warning
The trend is your friend… until it bends. 👀
💬 Which setup do you trust the most: Golden Cross or Trend Shift?
#StockMarket #Trading #TechnicalAnalysis #PriceAction #SwingTrading #DayTrading #Investing #GoldenCross #MovingAverage #TraderLife #MarketAnalysis #TradingTips #Nifty #Stocks #Finance #TradingEducation #BullMarket #BearMarket #GuideMeTrade 🚀📈

1
56

🚨 Most traders chase price… Smart traders wait for confirmation. 📊
✅ 5-8-13 Trend Shift
✅ Golden Cross (50 EMA > 200 EMA)
❌ Death Cross Warning
The trend is your friend… until it bends. 👀
💬 Which setup do you trust the most: Golden Cross or Trend Shift?
#StockMarket #Trading #TechnicalAnalysis #PriceAction #SwingTrading #DayTrading #Investing #GoldenCross #MovingAverage #TraderLife #MarketAnalysis #TradingTips #Nifty #Stocks #Finance #TradingEducation #BullMarket #BearMarket #GuideMeTrade 🚀📈
1
49

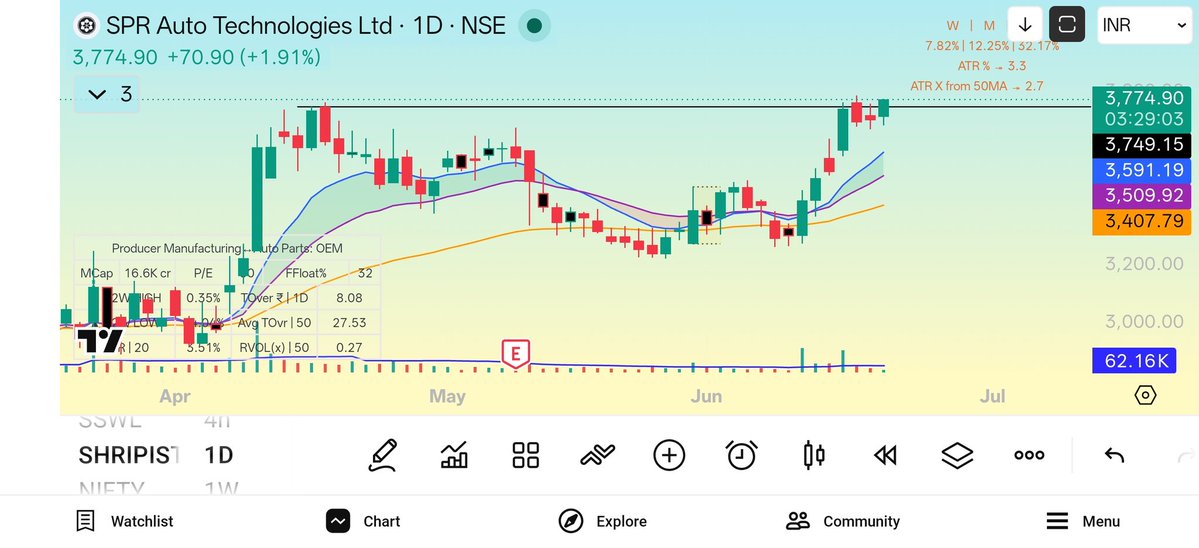
📊 SPR Auto Technologies Ltd.
Stock is trading above all key moving averages:
🔹 10 DMA ✅
🔹 20 DMA ✅
🔹 50 DMA ✅
Price is consolidating near its recent high after a strong upmove, indicating strength rather than weakness.
📈 10 DMA > 20 DMA > 50 DMA
📈 Bullish moving average alignment
📈 Higher High – Higher Low structure
📈 Momentum remains intact
As long as the stock holds above key moving averages, bulls remain in control.
Follow @Chartguruji1 for chart-based market insights.
#SPRAuto #TechnicalAnalysis #MovingAverage #PriceAction #StockMarketIndia #NSE #Chartguruji
1
35

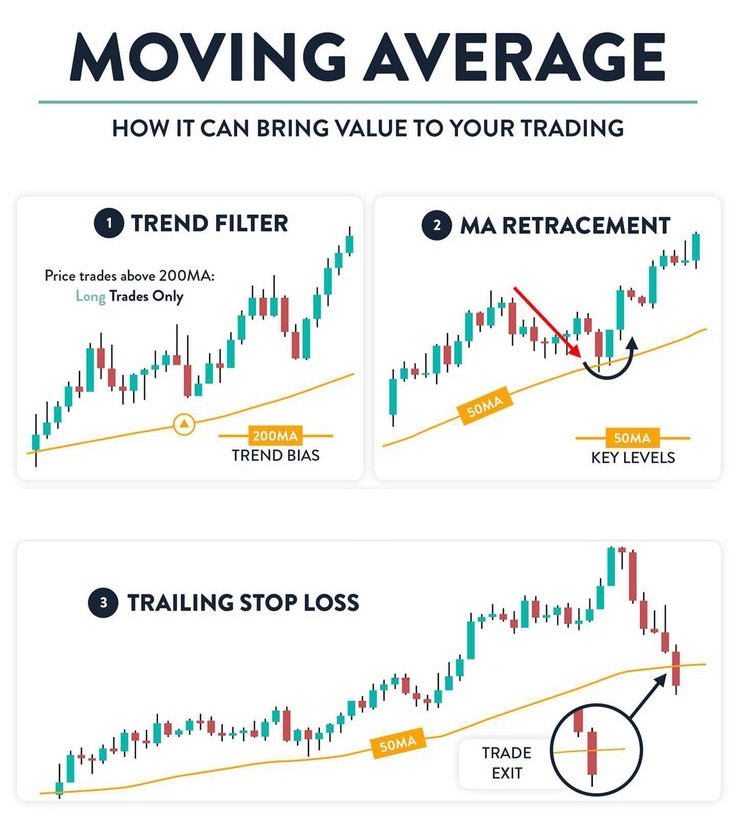
Moving Averages can add structure to your trading. 📊
Use them to identify the trend, spot retracements, and trail your stop loss effectively.
#Trading #MovingAverage #TechnicalAnalysis #StockMarket 📈

4
234

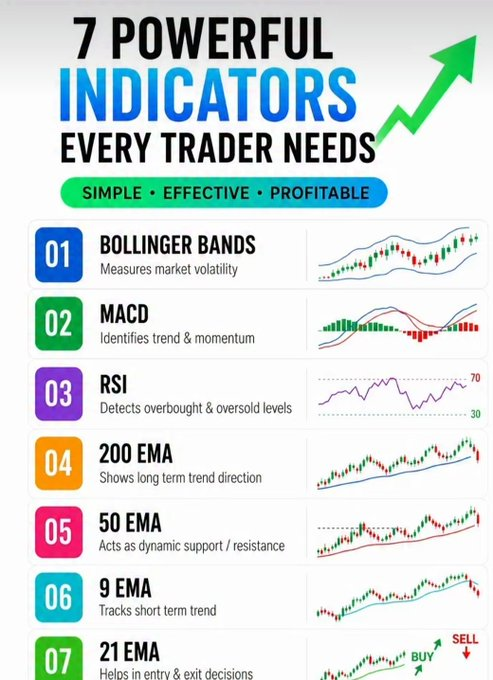
Most traders keep changing strategies... 👀
But the real question is:
Are you using the right indicators the right way? 📊
📈 Bollinger Bands for volatility
📈 MACD for momentum
📈 RSI for strength
📈 EMAs for trend & entries
Indicators don't make profits.
Understanding them does. 🎯🔥
Master the basics before chasing the next "holy grail" strategy.
Learn. Apply. Profit. 💰
Join now 👇
t.me/ s3mwF2i394thNDc1
Financial Independence Services | SEBI RA INH000021058
#StockMarket #Trading #TechnicalAnalysis #Indicators #RSI #MACD #BollingerBands #EMA #MovingAverage #PriceAction #SmartMoney #TradingStrategy #DayTrading #SwingTrading #Forex #Crypto #Investing #StockTrading #MarketAnalysis #TraderLife #LearnTrading #FinanceEducation #IndianStockMarket #Nifty50 #BankNifty #SEBIRegistered
39
Michael retweeted

#CDE and #NEM daily charts over the last 18 months.😊 Look at how consistently both have respected their #MovingAverage clouds, in both directions.
We're back at a decision point now.😌
#PreciousMetals #silver #gold #SilverMiners #GoldMiners
2
1
23
2,681
Moving Averages can add structure to your trading. 📊
Use them to identify the trend, spot retracements, and trail your stop loss effectively.
#Trading #MovingAverage #TechnicalAnalysis #StockMarket 📈

1
2
5
303

Jun 15
Stop treating moving averages like razor-thin lines where the price must bounce perfectly. The market doesn't work in exact numbers. Treat them as thick support or resistance zones. Wait for a clear rejection candle inside that whole zone before jumping in.
#movingaverage #EMA
17
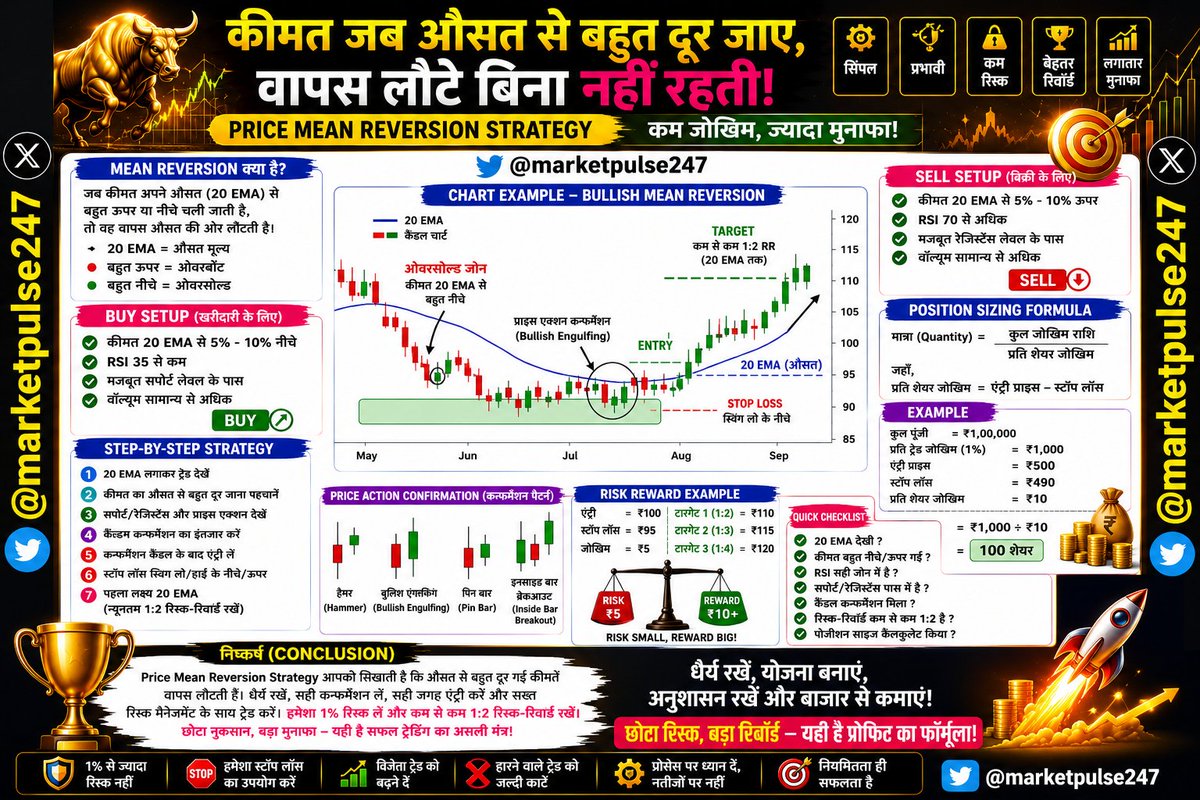
PRICE MEAN REVERSION STRATEGY: THE SIMPLE WAY TO BUY LOW, SELL HIGH AND CONTROL LOSSES
Most beginner traders lose money because they chase stocks after a big rally or panic-sell after a sharp decline. Professional traders often do the opposite. They understand a powerful concept called Mean Reversion. This strategy is based on the idea that prices tend to return to their average value after moving too far away from it.
Mean Reversion does not try to predict the future. Instead, it identifies situations where a stock has become temporarily overbought or oversold and is likely to move back toward its average price. When combined with proper risk management, it can become a highly effective daily trading strategy.
What is Mean Reversion?
Every stock has an average price, often represented by a moving average such as the 20 EMA or 50 EMA. When price moves too far above or below this average, it often pulls back toward the mean.
Think of a rubber band. The more you stretch it, the greater the chance it snaps back. Stock prices often behave in a similar way.
The Daily Trading Strategy
Step 1: Add a 20 EMA to Your Chart
The 20 EMA acts as the mean or average price.
Price far above 20 EMA = Potentially Overbought
Price far below 20 EMA = Potentially Oversold
Step 2: Look for Extreme Price Movement
For Buy Trades:
Stock falls 5% to 10% below the 20 EMA.
RSI below 35.
Strong support zone nearby.
For Sell Trades:
Stock rises 5% to 10% above the 20 EMA.
RSI above 70.
Major resistance zone nearby.
Step 3: Wait for Price Action Confirmation
Never enter blindly.
Look for:
Hammer Candle
Bullish Engulfing Candle
Strong Rejection Candle
Inside Bar Breakout
These patterns show that the reversal may have started.
Twitter id - x.com/@marketpulse247
Step 4: Entry
Enter after the confirmation candle closes.
Avoid trying to catch the exact bottom or top.
Step 5: Stop Loss
Place stop loss:
Below the recent swing low for buy trades.
Above the recent swing high for sell trades.
Always define risk before entering.
Twitter id - x.com/@marketpulse247
Step 6: Profit Target
Target the 20 EMA first.
If momentum remains strong, trail the stop loss and target higher levels.
Maintain a minimum 1:2 Risk-Reward Ratio.
Example:
Entry = ₹100
Stop Loss = ₹95
Risk = ₹5
Target = ₹110 or higher.
Position Sizing Formula
Risk management is the key to long-term survival.
Formula
Quantity = Total Risk Amount ÷ Risk Per Share
Where:
Risk Per Share = Entry Price – Stop Loss Price
Example
Trading Capital = ₹1,00,000
Risk Per Trade = 1%
Maximum Risk = ₹1,000
Entry = ₹500
Stop Loss = ₹490
Risk Per Share = ₹10
Quantity = ₹1,000 ÷ ₹10
Quantity = 100 Shares
This ensures that even if the trade fails, the loss remains controlled.
Twitter id - x.com/@marketpulse247
Why This Strategy Works
Most traders act emotionally. They buy after a stock has already moved significantly higher and sell after a large decline. Mean Reversion takes advantage of this emotional behavior.
By waiting for extreme moves away from the average price and entering only after confirmation, traders can often obtain better entries with smaller stop losses and larger potential rewards.
Twitter id - x.com/@marketpulse247
CONCLUSION
The Price Mean Reversion Strategy is one of the simplest and most logical trading approaches available. It teaches traders to avoid chasing momentum and instead focus on opportunities where price has moved too far from its average. By combining the 20 EMA, RSI, support and resistance, and strong price action confirmation, traders can identify high-probability setups with controlled risk. The real secret is not finding perfect trades but managing risk properly. Keep losses small, maintain a minimum 1:2 risk-reward ratio, and risk only 1% of your capital per trade. Over time, this disciplined approach can help you stay profitable while avoiding the large losses that destroy most trading accounts.
Twitter id - x.com/@marketpulse247
Chartink Scanner Formula (Mean Reversion Strategy)
Bullish Mean Reversion Scanner
close < ema(close,20) * 0.95
and rsi(14) < 35
and close > open
and volume > sma(volume,20)
Aggressive Oversold Reversal Scanner
close < ema(close,20) * 0.90
and rsi(14) < 30
and volume > sma(volume,20) * 1.5
Mean Reversion Bounce Scanner
close crossed above ema(close,20)
and rsi(14) > 40
and volume > sma(volume,20)
Twitter id - x.com/@marketpulse247
Twitter/X
#MeanReversion #MeanReversionTrading #PriceAction #TradingStrategy #StockMarket #Trading #StockTrading #IntradayTrading #SwingTrading #DayTrading #TechnicalAnalysis #ChartAnalysis #EMA20 #MovingAverage #RSI #RSITrading #SupportAndResistance #CandlestickPatterns #ReversalTrading #MomentumTrading #RiskManagement #RiskReward #PositionSizing #MoneyManagement #TradingPsychology #TradingDiscipline #TradingEducation #LearnTrading #BeginnerTrader #StockMarketLearning #MarketAnalysis #StockMarketIndia #IndianStockMarket #Nifty50 #BankNifty #TradeSmart #ProfitableTrading #TradingTips #SmartMoney #MarketPulse247 #FinancialFreedom #WealthCreation #CapitalPreservation #BullMarket #TraderLife #StockMarketTips #InvestmentTips #TradingSuccess
प्राइस मीन रिवर्ज़न रणनीति: कम नुकसान और बेहतर मुनाफे के लिए एक सरल ट्रेडिंग तरीका
अधिकांश नए ट्रेडर तब शेयर खरीदते हैं जब वह तेजी से ऊपर भाग चुका होता है और तब बेचते हैं जब उसमें बड़ी गिरावट आ चुकी होती है। यही कारण है कि वे अक्सर नुकसान उठाते हैं। सफल ट्रेडर एक अलग सिद्धांत का उपयोग करते हैं जिसे मीन रिवर्ज़न (Mean Reversion) कहा जाता है। इस सिद्धांत के अनुसार किसी भी शेयर की कीमत यदि अपने औसत मूल्य से बहुत अधिक ऊपर या नीचे चली जाए, तो समय के साथ वह दोबारा अपने औसत मूल्य के आसपास लौटने की कोशिश करती है।
मीन रिवर्ज़न रणनीति का उद्देश्य भविष्य की भविष्यवाणी करना नहीं है, बल्कि उन अवसरों को पहचानना है जहाँ कीमत अपने वास्तविक औसत से बहुत दूर चली गई हो और वापसी की संभावना अधिक हो।
मीन रिवर्ज़न क्या है?
हर शेयर का एक औसत मूल्य होता है जिसे हम आमतौर पर 20 EMA (Exponential Moving Average) या 50 EMA से मापते हैं।
यदि कीमत 20 EMA से बहुत ऊपर है, तो शेयर ओवरबॉट (Overbought) हो सकता है।
यदि कीमत 20 EMA से बहुत नीचे है, तो शेयर ओवरसोल्ड (Oversold) हो सकता है।
इसे एक रबर बैंड की तरह समझिए। जितना अधिक उसे खींचेंगे, उतनी ही संभावना होगी कि वह वापस अपनी सामान्य स्थिति में लौटेगा। शेयर बाजार में भी कीमतें अक्सर इसी प्रकार व्यवहार करती हैं।
दैनिक ट्रेडिंग के लिए मीन रिवर्ज़न रणनीति
चरण 1: चार्ट पर 20 EMA लगाएँ
20 EMA को औसत मूल्य माना जाएगा।
चरण 2: अत्यधिक मूल्य विचलन खोजें
खरीदारी (Buy) के लिए:
कीमत 20 EMA से 5% से 10% नीचे हो।
RSI 35 से कम हो।
पास में मजबूत सपोर्ट लेवल हो।
बिक्री (Sell) के लिए:
कीमत 20 EMA से 5% से 10% ऊपर हो।
RSI 70 से अधिक हो।
पास में मजबूत रेजिस्टेंस लेवल हो।
चरण 3: प्राइस एक्शन की पुष्टि करें
बिना पुष्टि के कभी ट्रेड न लें।
निम्नलिखित कैंडल पैटर्न देखें:
हैमर (Hammer)
बुलिश एंगल्फिंग (Bullish Engulfing)
मजबूत रिजेक्शन कैंडल
इनसाइड बार ब्रेकआउट
ये संकेत देते हैं कि रिवर्सल शुरू हो सकता है।
Twitter id - x.com/@marketpulse247
चरण 4: एंट्री लें
कन्फर्मेशन कैंडल के बंद होने के बाद ही ट्रेड में प्रवेश करें।
चरण 5: स्टॉप लॉस लगाएँ
खरीदारी में हाल के स्विंग लो के नीचे।
बिक्री में हाल के स्विंग हाई के ऊपर।
Twitter id - x.com/@marketpulse247
चरण 6: लक्ष्य निर्धारित करें
पहला लक्ष्य 20 EMA रखें।
हमेशा कम से कम 1:2 रिस्क-रिवॉर्ड अनुपात बनाए रखें।
Twitter id - x.com/@marketpulse247
उदाहरण:
एंट्री = ₹100
स्टॉप लॉस = ₹95
जोखिम = ₹5
लक्ष्य = ₹110 या उससे अधिक
पोजीशन साइजिंग फॉर्मूला
सफल ट्रेडिंग का सबसे महत्वपूर्ण हिस्सा जोखिम नियंत्रण है।
फॉर्मूला
मात्रा (Quantity) = कुल जोखिम राशि ÷ प्रति शेयर जोखिम
जहाँ,
प्रति शेयर जोखिम = एंट्री प्राइस – स्टॉप लॉस
उदाहरण
कुल पूंजी = ₹1,00,000
प्रति ट्रेड जोखिम = 1%
अधिकतम जोखिम = ₹1,000
एंट्री = ₹500
स्टॉप लॉस = ₹490
प्रति शेयर जोखिम = ₹10
मात्रा = ₹1,000 ÷ ₹10
मात्रा = 100 शेयर
इस प्रकार यदि ट्रेड गलत भी हो जाए तो अधिकतम नुकसान केवल ₹1,000 रहेगा।
यह रणनीति क्यों काम करती है?
अधिकांश ट्रेडर भावनाओं के आधार पर निर्णय लेते हैं। वे तेजी में खरीदते हैं और गिरावट में बेचते हैं। मीन रिवर्ज़न रणनीति इस मनोवैज्ञानिक गलती का लाभ उठाती है।
जब कीमत अपने औसत से बहुत दूर चली जाती है और फिर वापसी के संकेत देती है, तब कम जोखिम में बेहतर एंट्री मिलने की संभावना बढ़ जाती है। यही कारण है कि यह रणनीति लंबे समय तक प्रभावी साबित होती है।
Twitter id - x.com/@marketpulse247
निष्कर्ष
प्राइस मीन रिवर्ज़न रणनीति उन ट्रेडरों के लिए एक शानदार तरीका है जो कम जोखिम के साथ नियमित मुनाफा कमाना चाहते हैं। यह रणनीति आपको बाजार का पीछा करने के बजाय धैर्यपूर्वक सही अवसर का इंतजार करना सिखाती है। 20 EMA, RSI, सपोर्ट-रेजिस्टेंस और मजबूत प्राइस एक्शन को मिलाकर आप उच्च गुणवत्ता वाले ट्रेड खोज सकते हैं। याद रखें कि सफल ट्रेडिंग का रहस्य सही एंट्री से ज्यादा सही जोखिम प्रबंधन में छिपा होता है। हमेशा अपनी कुल पूंजी का केवल 1% जोखिम लें, न्यूनतम 1:2 रिस्क-रिवॉर्ड अनुपात रखें और बड़े नुकसान से बचें। यदि आप लगातार अनुशासन के साथ इस रणनीति का पालन करते हैं, तो लंबे समय में आपकी ट्रेडिंग स्थिर और लाभदायक बन सकती है।
4
12
387

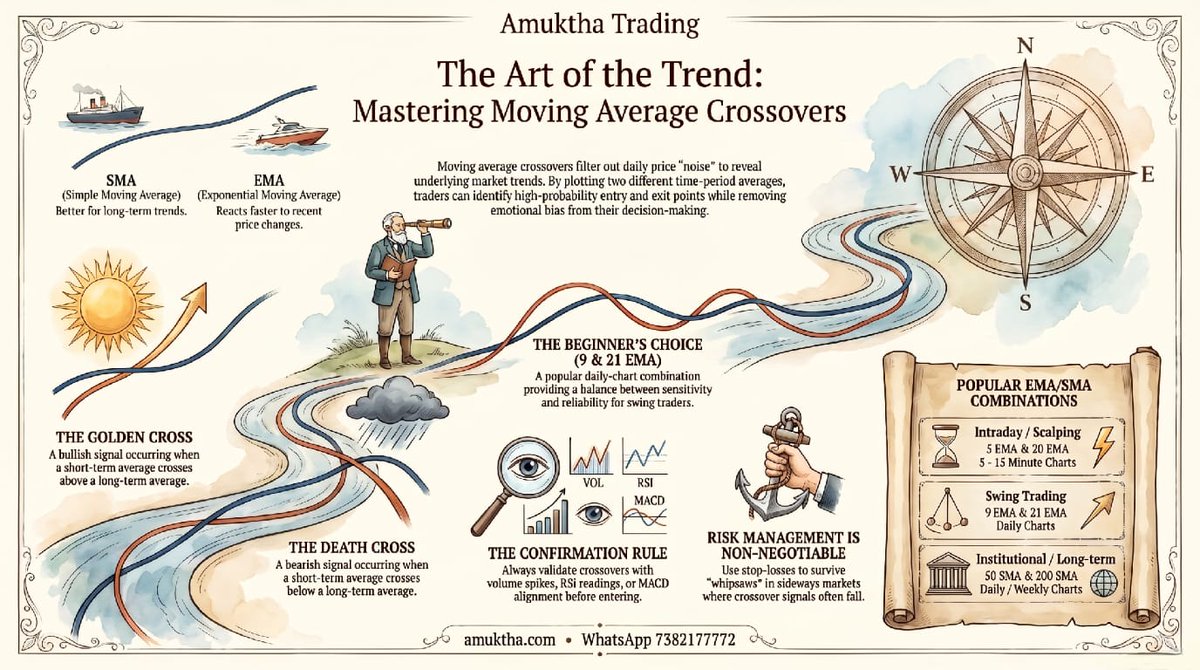
50-day MA crosses above 200-day MA.
That's a Golden Cross, one of the most powerful bull signals in any market. Institutions watch it. You should too
DM "GOLDEN"
#StockMarket #trading #tradingscam #TradingMindset #tradingstrategy #movingaverage #tradingeducation
1
2
12

Jun 12
📘 Lesson 44: What is a Moving Average?
A Moving Average smooths price data to help identify trends.
📈 SMA – Average price over a period
📊 EMA – Gives more weight to recent prices
📌 Used to observe direction, trend strength, and reduce market noise.
#Nupips #MovingAverage

1
5

🕯️ Multi-MA Toolkit
All-in-one system:
• EMAs SMAs
• VWAP
• RSI ATR
• Trend filters
No more cluttered charts.
tradingview.com/script/ioD0d…
#movingaverage #simplemovingaverage #sma #vwap

1
34
Moving Averages can add structure to your trading. 📊
Use them to identify the trend, spot retracements, and trail your stop loss effectively.
#Trading #MovingAverage #TechnicalAnalysis #StockMarket 📈
3
7
218
📌 Liquidity Inflow Stocks (Rising Money Flow)
1️⃣ Aegis Vopak Terminals
2️⃣ Zen Technologies
3️⃣ R R Kabel
4️⃣ Inox Wind
5️⃣ J Kumar Infraprojects
These stocks are showing strong relative strength compared to the broader market 👀
Keep them on your watchlist for potential momentum and swing trading opportunities 🎯
Follow & Subscribe GuideMeTrade & GuideMeInvest | by Pradeep Jaiswal 🚀
#TradingSetup #StockMarket #cryptocurrency #forex #CandlestickPatterns #ChartAnalysis #TradingEducation #TradingPsychology #PriceActionTrading #SmartMoney #SmartMoneyConcepts #MovingAverage #IntradayTrading #SwingTrading #Scalping #DayTrading #TechnicalTrader #ChartPatterns #Forex #Crypto #CryptoTrading #Bitcoin #Ethereum #Nifty #BankNifty #Sensex #DowJones #Nasdaq #StockMarketIndia #ShareMarket #Investing #TradingCommunity #MarketAnalysis
2
166
📌 Relative Outperformance Stocks (Beating the Index) 📈🔥
1️⃣ Shilchar Technologies
2️⃣ Balu Forge Industries
3️⃣ Kirloskar Pneumatic Company
4️⃣ eMudhra
5️⃣ Raghav Productivity Enhancers
These stocks are showing strong relative strength compared to the broader market 👀
Keep them on your watchlist for potential momentum and swing trading opportunities 🎯
Follow & Subscribe GuideMeTrade & GuideMeInvest | by Pradeep Jaiswal 🚀
#TradingSetup #StockMarket #cryptocurrency #forex #CandlestickPatterns #ChartAnalysis #TradingEducation #TradingPsychology #PriceActionTrading #SmartMoney #SmartMoneyConcepts #MovingAverage #IntradayTrading #SwingTrading #Scalping #DayTrading #TechnicalTrader #ChartPatterns #Forex #Crypto #CryptoTrading #Bitcoin #Ethereum #Nifty #BankNifty #Sensex #DowJones #Nasdaq #StockMarketIndia #ShareMarket #Investing #TradingCommunity #MarketAnalysis #Ca
2
416
Sector Leader Stocks (Top Performers)
1️⃣ CG Power and Industrial Solutions
2️⃣ Bharat Electronics
3️⃣ Premier Energies
4️⃣ Coforge
5️⃣ APL Apollo Tubes
#TradingSetup #StockMarket #cryptocurrency #forex #CandlestickPatterns #ChartAnalysis #TradingEducation #TradingPsychology #PriceActionTrading #SmartMoney #SmartMoneyConcepts #MovingAverage #IntradayTrading #SwingTrading #Scalping #DayTrading #TechnicalTrader #ChartPatterns #Forex #Crypto #CryptoTrading #Bitcoin #Ethereum #Nifty #BankNifty #Sensex #DowJones #Nasdaq #StockMarketIndia #ShareMarket #Investing #TradingCommunity #MarketAnalysis #Candlestick
2
201
📌 Strong Delivery Based Buying Stocks
1️⃣ Jindal Stainless
2️⃣ Graphite India
3️⃣ KPI Green Energy
4️⃣ Century Textiles and Industries
5️⃣ Welspun Corp
#TradingSetup #StockMarket #cryptocurrency #forex #CandlestickPatterns #ChartAnalysis #TradingEducation #TradingPsychology #PriceActionTrading #SmartMoney #SmartMoneyConcepts #MovingAverage #IntradayTrading #SwingTrading #Scalping #DayTrading #TechnicalTrader #ChartPatterns #Forex #Crypto #CryptoTrading #Bitcoin #Ethereum #Nifty #BankNifty #Sensex #DowJones #Nasdaq #StockMarketIndia #ShareMarket #Investing #TradingCommunity #MarketAnalysis #Candlestick
5
496
📌 Volume Price Breakout Combo Stocks
1️⃣ Rashi Peripherals
2️⃣ ESAF Small Finance Bank
3️⃣ Medi Assist Healthcare Services
4️⃣ Protean eGov Technologies
5️⃣ V2 Retail
#TradingSetup #StockMarket #cryptocurrency #forex #CandlestickPatterns #ChartAnalysis #TradingEducation #TradingPsychology #PriceActionTrading #SmartMoney #SmartMoneyConcepts #MovingAverage #IntradayTrading #SwingTrading #Scalping #DayTrading #TechnicalTrader #ChartPatterns #Forex #Crypto #CryptoTrading #Bitcoin #Ethereum #Nifty #BankNifty #Sensex #DowJones #Nasdaq #StockMarketIndia #ShareMarket #Investing #TradingCommunity #MarketAnalysis #Candlestick
2
282