
New Project in GIS & Spatial Analysis
Climate Analysis of Egypt Using GIS & Remote Sensing 🌍📊
This is not just a map — it is a complete spatial analysis workflow transforming climate data into meaningful geographic insights.
This project involved:
✔️ Climate Data Analysis
✔️ Spatial Interpolation Techniques
✔️ DEM Processing & Terrain Analysis
✔️ Raster Visualization
✔️ Professional Cartographic Design
✔️ GIS-Based Climate Modeling
The analysis highlights:
* The temperature gradient between northern and southern Egypt
* The climatic influence of the Mediterranean coast
* Rainfall concentration across the northern coast and Sinai
* The Nile Valley acting as a green corridor within an arid environment
Our work goes beyond producing maps.
We transform spatial data into decision-support tools that can be applied in:
🌱 Agriculture
🌊 Water Resources & Flood Management
🏙️ Urban Planning
🌍 Environmental Studies
📚 Academic Research & Scientific Projects
If you are looking for professional work in:
✔️ GIS & Remote Sensing
✔️ Hydrological Analysis
✔️ Flood Risk Mapping
✔️ Climate & Environmental Analysis
✔️ Cartography & Map Design
✔️ Academic or Professional GIS Projects
We would be pleased to collaborate with you.
📩 Feel free to contact us directly
and follow our page for more professional GIS projects and spatial analysis work.
#GIS
#RemoteSensing
#SpatialAnalysis
#ClimateAnalysis
#Hydrology
#Cartography
#ArcGIS
#QGIS
#EnvironmentalStudies
#FloodRisk
#Egypt
#Geospatial
#GISProjects
#DigitalMapping

12

50 Years of Heat Stress Over Pakistan (1975-2025)
We analyzed the Universal Thermal Climate Index (UTCI), a biometeorological metric integrating air temperature, humidity, wind speed, and radiation into a single human thermal comfort index, across Pakistan using ERA5 reanalysis data.
Pakistan's annual mean UTCI has risen by 2.00°C over five decades, at a statistically significant rate of 0.23°C/decade (p < 0.0001). The upward trajectory is unmistakable and accelerating into the 2020s.
Monthly UTCI distributions reveal a clear seasonal danger window. May-September consistently breaches the Strong Heat Stress threshold (32°C UTCI), while June-July regularly pushes into Very Strong Heat Stress (≥38°C UTCI) conditions posing serious physiological risk to outdoor populations.
Per-pixel summer trend analysis shows Northern Pakistan and Balochistan warming at 0.25 to 0.30°C/decade. A localized cooling signal in the central Indus Valley (~28°N) is also observed, likely linked to irrigation-driven evaporative cooling a dynamic worth investigating further. Dotted pixels on the map indicate statistically significant trends.
UTCI captures what the human body actually experiences, not just air temperature. At ≥38°C UTCI, thermoregulation is under severe strain, hitting outdoor workers and vulnerable populations hardest. Pakistan contributes less than 1% of global emissions yet remains among the world's most climate-vulnerable nations.
📌 Data: ERA5 | UTCI Index | 1975-2025 | Per-pixel Mann-Kendall trend analysis
The data is clear. The urgency is real. The time to act is now.
#ClimateScience #HeatStress #UTCI #Pakistan #ERA5 #ClimateAnalysis #Heatwave #SouthAsiaClimate #ClimateJustice #Climatology


1
30

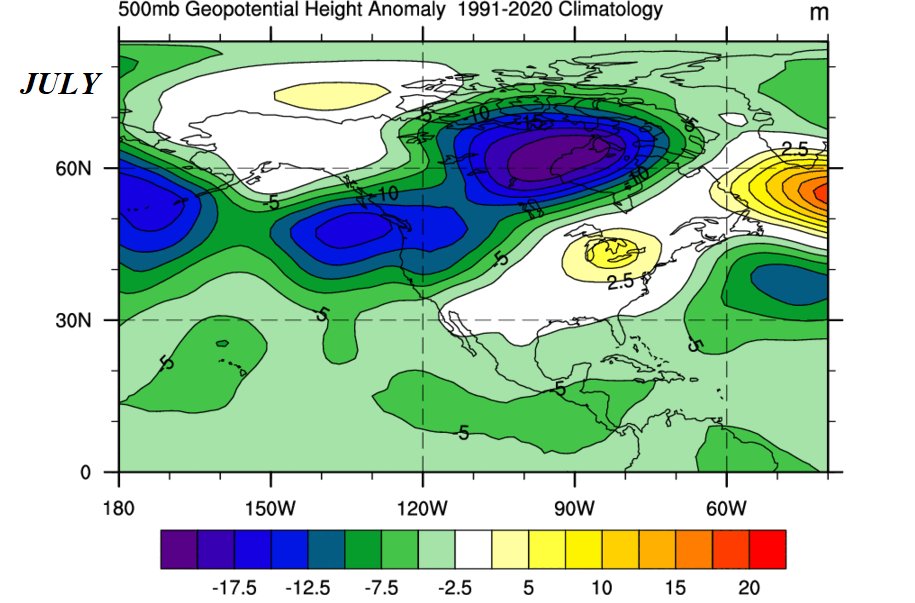
🌪️📊📡Atlantic & Pacific Hurricane Season Outlook , Summer and Autumn 2026- (Analog-Based) #North_America #hurricanes.
Much of the current narrative pointing to a weak 2026 hurricane season is driven by social media hype around a “super El Niño,” but this appears temporally misaligned.
The available signals suggest a later ENSO peak toward December, not during the core summer months when Atlantic activity is most affected .
The outlook here is based on a 32-analog ensemble (1860–2025) used to reconstruct 500 hPa patterns, derived from a multivariable statistical framework that integrates multiple sources of climate forcing, offering a more grounded perspective beyond simplified ENSO assumptions.
The large-scale analog signal continues to support a near-normal to slightly above-normal Atlantic hurricane season, despite ongoing narratives of suppression due to a potential El Niño.
Key driver: the expected ENSO peak is late (Dec–Jan) → meaning limited shear impact during the core season (Aug–Sep).
Monthly Evolution (Atlantic & NPA context)
July
NPA: modest troughing, transitional flow
MDR: gradually organizing
Storm zones: Caribbean, W. Atlantic
→ Early-stage activity, not yet dominant
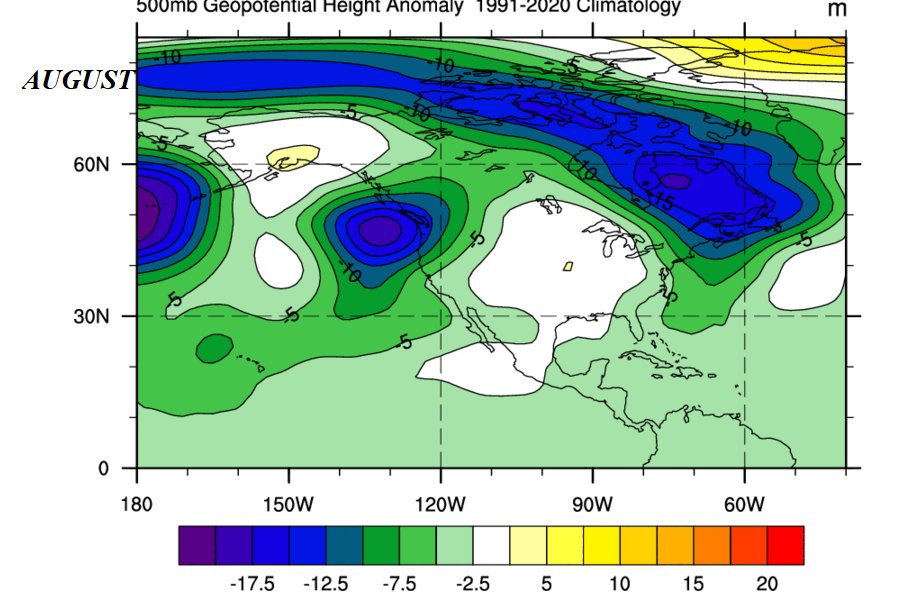
August
NPA: deeper trough into W. North America → reduced Atlantic shear windows
MDR: ridge strengthening, improving wave propagation
Storm zones: MDR → Caribbean → Bahamas
→ Clear ramp-up phase
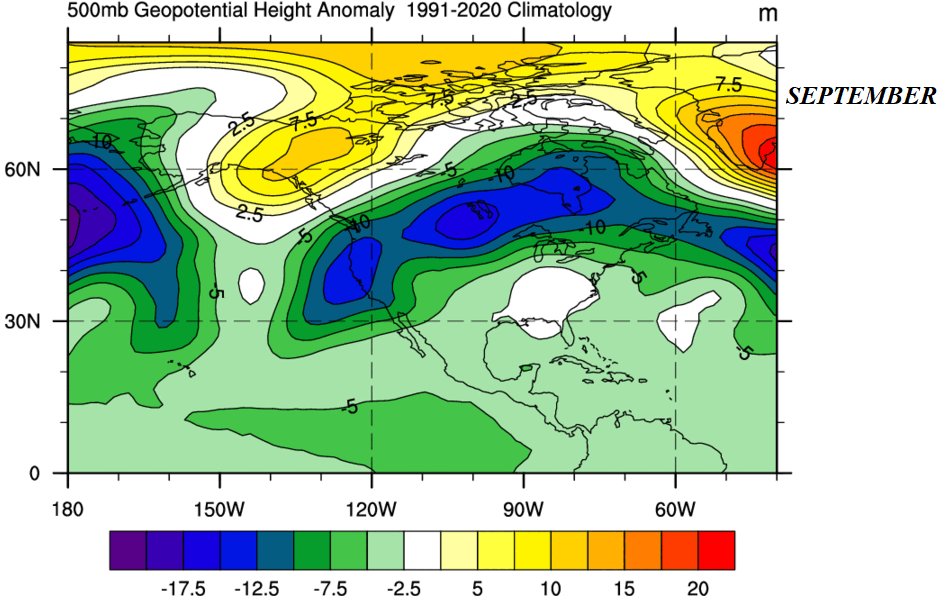
September (Peak)
NPA: structured waveguide, balanced ridge–trough pattern
MDR: fully active, low shear pockets
Storm zones: Cape Verde → long-track hurricanes → W. Atlantic re-curvature
→ ACE peak aligns with climatology
October
NPA: increased trough penetration southward
MDR: weakening, shift westward
Storm zones: Caribbean, Gulf, W. Atlantic
→ Higher land-interaction & hybrid systems
November
NPA: trough-dominated regime
MDR: suppressed, activity contracts
Storm zones: Western Caribbean focus
→ Late-season residual activity
Pacific (Brief)
Eastern Pacific likely near-normal to slightly active early, with activity modulated by evolving ENSO structure
Gradual shift in activity distribution as the season progresses, with less coherent suppression signal than typically assumed
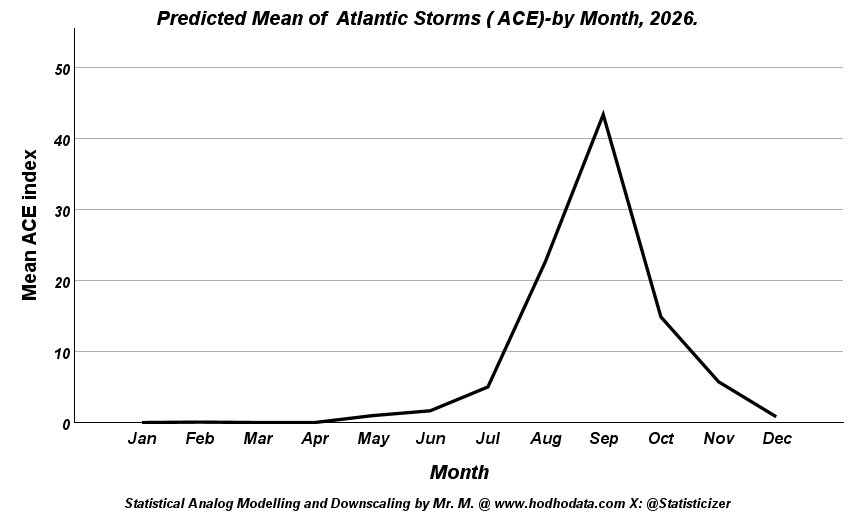
🎯The Punch line :
The synoptic evolution ACE analogs closely match climatology, particularly the September peak.
There is no strong signal for a suppressed Atlantic season at this stage. The expected ACE indices sit near the climatological average expected for the like seasons ( neither much less nor much more ) .
If El Niño develops, its main atmospheric imprint is likely delayed into late 2026 and early 2027, not during peak hurricane months.
❗️The October and November expected 500 hpa synoptic maps and storm track detailed monthly interpretation are added in the comments.
Other forecasts for the atlantic region had also been post in the comments-from the last week.
Warmest Regards,
Statistical Analog Modelling & Downscaling By Mr. M @Statisticizer. / hodhodata.com , Irbid -Jordan.
___________________
#AtlanticHurricaneSeason #HurricaneSeason2026 #TropicalCyclones
#ACEIndex #ENSO #ElNino #ClimateSignals
#NorthPacific #MDR #WeatherPatterns
#HurricaneForecast #LongRangeForecast #ClimateAnalysis
#EarlyWarning #DisasterPreparedness
3
7
33
5,756
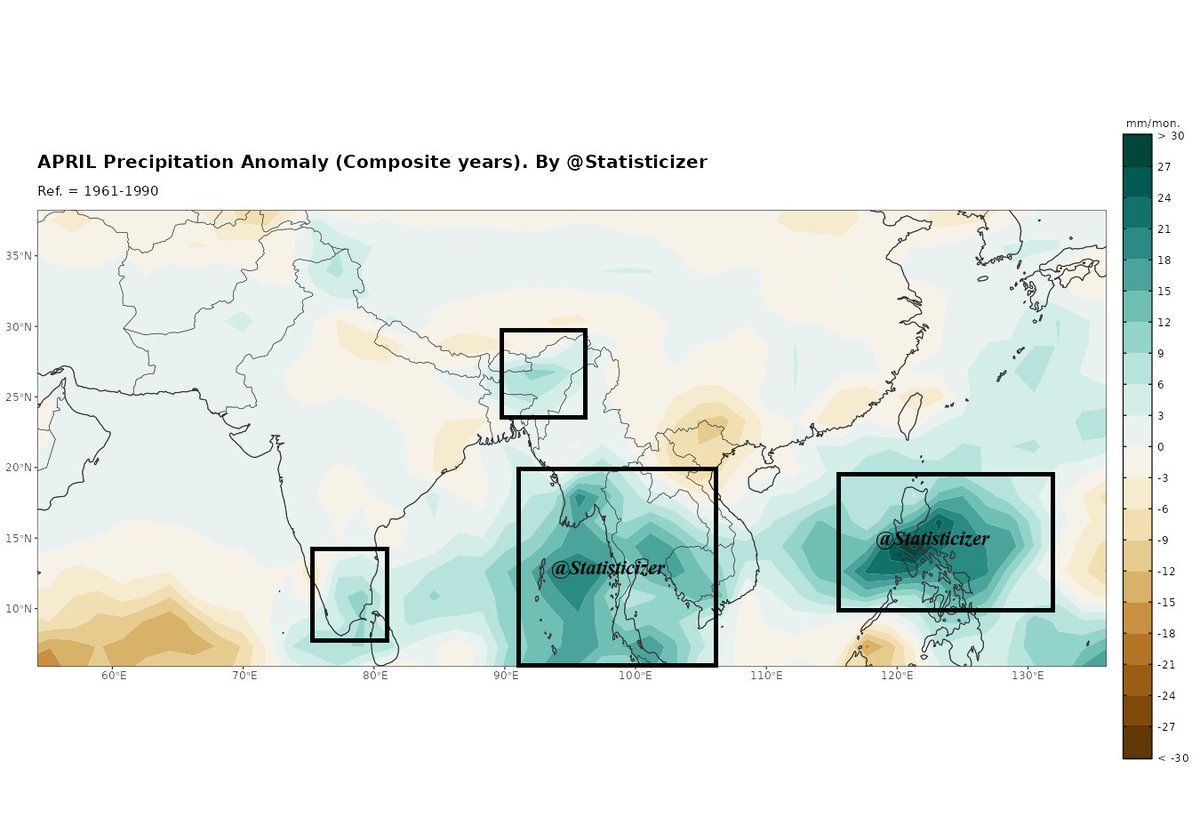
🌏 #India #Monsoon All-India-Rainfall (AIR) Outlook (April–July) | Interim Prediction. South East Asia Flood Risk predictions 2026 .
This outlook is based on 42 statistical analog seasons, identified using AI (ANN) and advanced statistical modeling applied to long-term climate datasets (ENSO, PDO, Indo-Pacific warming index, and Atmospheric Angular Momentum Plus reconstructed AIR index ) extending back to 1860 . The results represent a probabilistic rainfall pattern, not a deterministic forecast.
🌧️ How to Read the Colors
🟢 Green: Above-average rainfall
🌲 Deep Green: ⚠️ High probability of heavy rainfall / flood risk
⚪ White: Near normal
🟤 Brown: Below-average rainfall (dry conditions)
📅 Temporal Evolution
🔹 April (Pre-Monsoon Phase)
Signals remain weak and scattered. Early moisture build-up appears over the southern Bay of Bengal and parts of Southeast Asia, but rainfall is still localized and not fully organized.
🔹 May (Early Organization Phase)
A clear strengthening trend begins:
Eastern India, Bangladesh, and the Bay of Bengal show deep green anomalies
Increasing activity over southern India
➡️ This points to an early organization and strengthening of the monsoon system
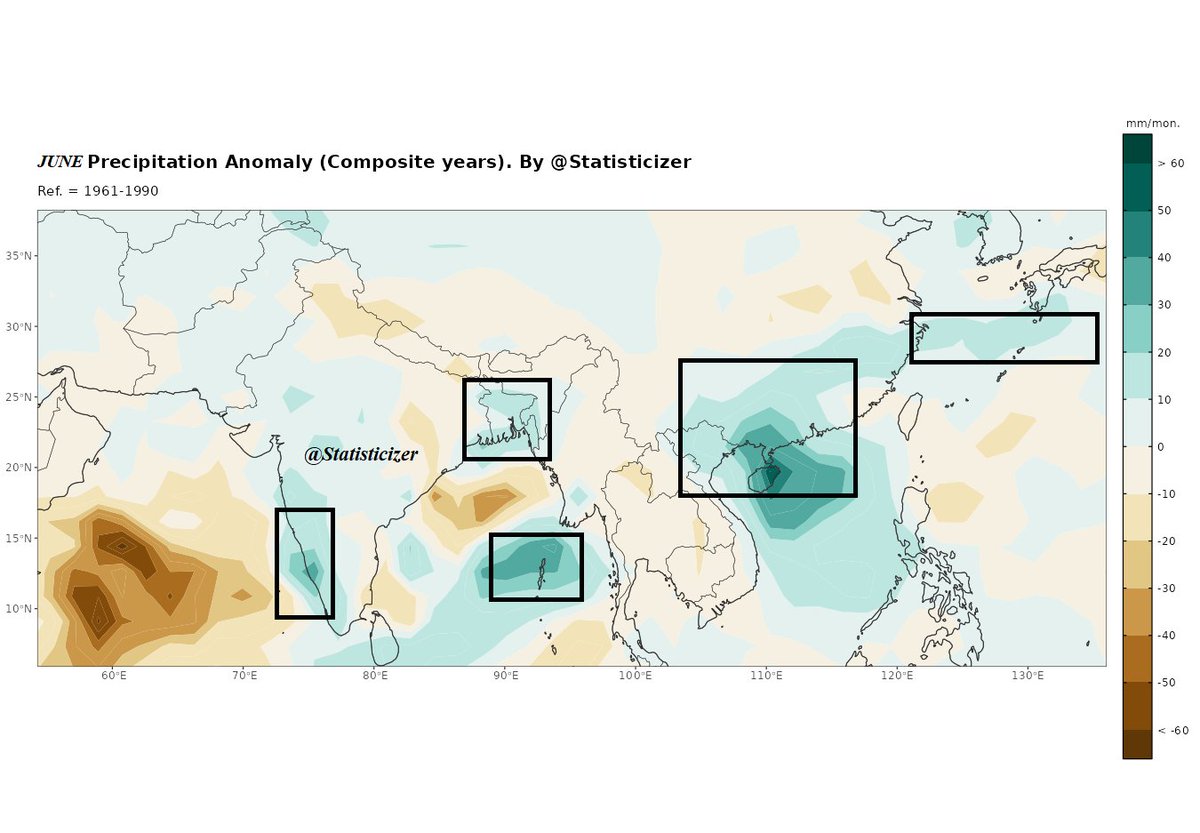
🔹 June (Expansion Phase)
Rainfall becomes more structured and widespread
Strong signals shift toward the Bay of Bengal, eastern India, and Southeast Asia
Parts of central India may experience temporary weakening (break-like phases)
➡️ A developing but regionally uneven monsoon
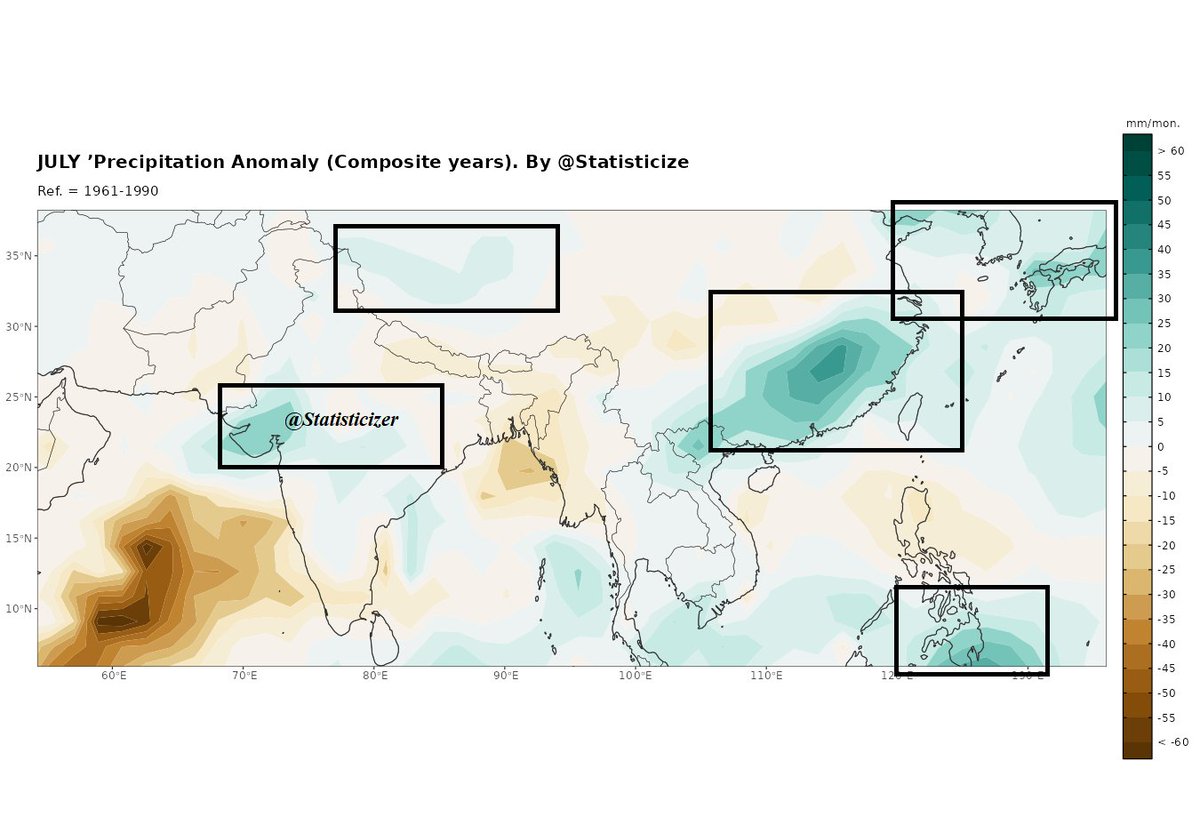
🔹 July (Peak Phase)
Peak monsoon conditions, though less uniform than classic strong years
Stronger anomalies persist over the northern Bay of Bengal and East Asia, while parts of India show mixed signals
➡️ Suggests active pulses rather than continuous widespread rainfall
⚖️ Strengthening vs Weakening Signals
Strengthening:
Early intensification is evident from May into June, especially across eastern sectors (Bay of Bengal, Bangladesh, Northeast India), indicating a front-loaded monsoon development.
Weakening / Redistribution:
By June–July, signals become less consistent over central and western India, suggesting break phases or shifting rainfall corridors rather than uniform coverage.
⚠️ Flood Risk Regions (Highlighted Boxes)
The highlighted regions align with historically flood-prone zones during monsoon surges, especially under deep green anomalies:
Eastern India & Bangladesh → Primary flood hotspot
Bay of Bengal coastal belt → Surge-driven heavy rainfall
Parts of Southeast Asia → Secondary flood risk
Southern Arabian Sea / Southwest India (early phase) → Localized heavy rainfall risk
🌧️ Philippines (Western Pacific / Maritime Continent)
April–May:
Clear green to deep green anomalies → early moisture buildup
➤ Indicates active convection and strong tropical moisture supply
June:
Signals remain strong and organized
➤ A highly energized Western Pacific feeding the monsoon system
July:
Still positive but slightly weaker in some areas
➤ Continued activity with redistribution of rainfall zones
🌧️ South China (Guangdong, Guangxi, South China Sea)
April:
Weak to moderate signals → early-stage development
May:
Strengthening begins, especially toward the South China Sea
June:
Peak signal with strong green anomalies
➤ Consistent with Meiyu / early summer rainband development
July:
Signals persist but become more diffuse and eastward-shifted
➤ Suggests episodic heavy rainfall and shifting rainbelt dynamics
🌲 Key Risk Indicator
Areas showing deep green anomalies should be closely monitored for:
Intense rainfall bursts
River overflow
Flash flooding during peak phases
🔎 Bottom Line
A relatively early strengthening monsoon signal is evident
Rainfall likely peaks during May–June, with shifting intensity into July
Expect episodic heavy rainfall, especially across eastern regions
Flood risk is elevated in key zones during active pulses
This is a pattern-based outlook, and updates closer to the season will refine regional detail.
📢 Kindly share the forecast. Due to time constraints, regional follow-up is prioritized where audience engagement is higher.
Statistical Modelling By: @Statisticizer
The Principal Data Scientist – at Alhodhod Data Analysis Services.
Irbid, Jordan
#IndiaMonsoon #Rainfall #FloodRisk #ClimateAnalysis #Monsoon2026

5
10
77
5,942

Mar 23
Is the 1.5°C Goal Dead? How the US-Israel-Iran War is Destroying the Climate.
#FreePressJournal #FPJ #ClimateAnalysis #BreakingNews #WorldAffairs #ScienceCommunication #GlobalCrisis2026 #EnvironmentalJustice #USForeignPolicy #IsraelIranConflict #MiddleEastCrisis #InternationalRelations #GlobalEconomy #OilPrices #ConflictandEnvironment #RegionalStability #PoliticalAnalysis
1
124

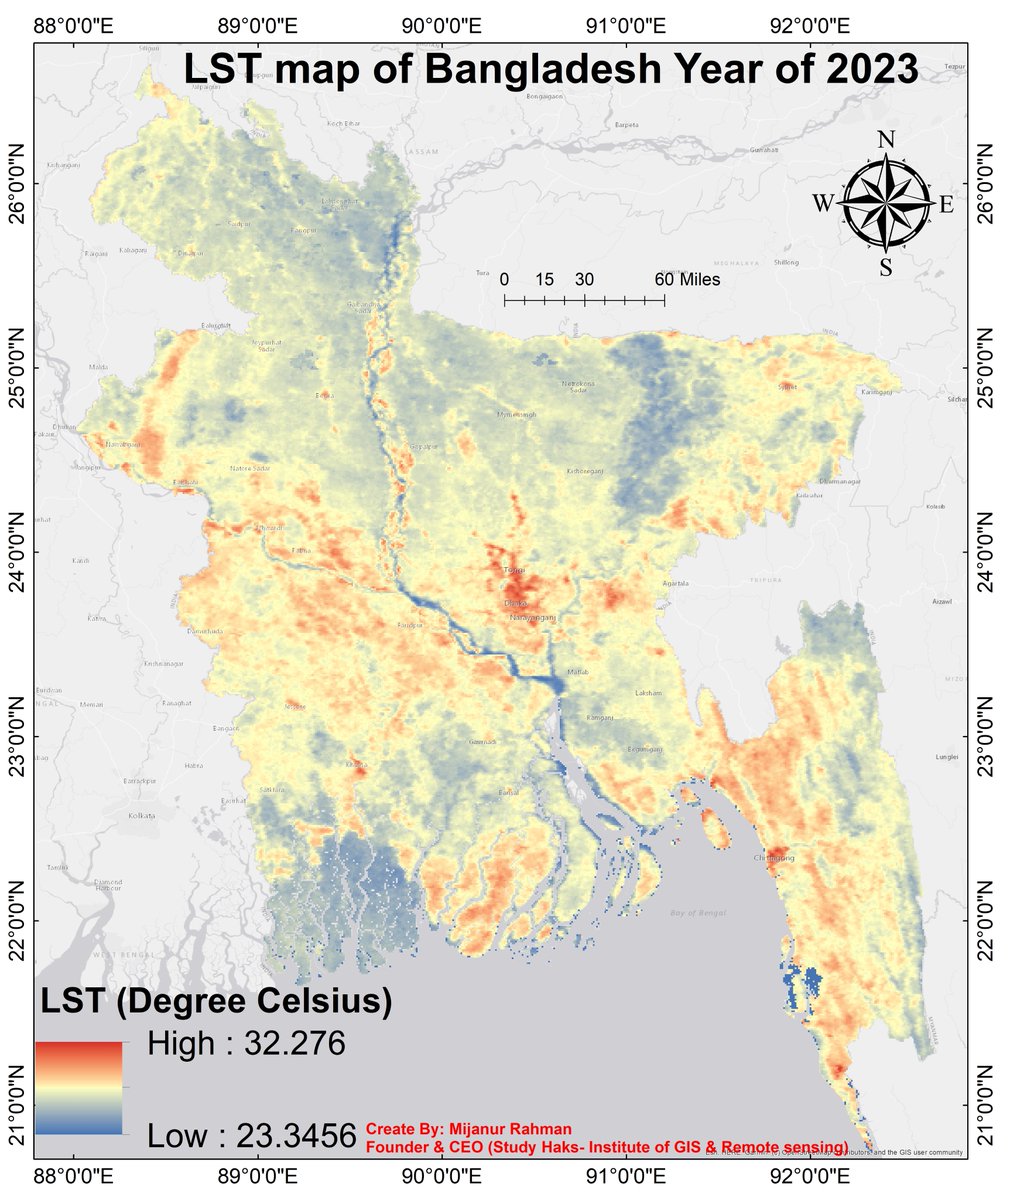
🔥 Can YOU Create a LST Map Like This? 🌡️🇧🇩
Registration info: studyhacksgeospatial.com/goo…
#GoogleEarthEngine #RemoteSensing #GIStraining #ClimateAnalysis #LST #UrbanHeatIsland #MachineLearning #SpatialAnalysis #Geospatial #EnvironmentalScience #StudyHacks #GISRSInstitute
1
19
748

Feb 12
Pakistan Achieves Milestone with Launch of Indigenous EO-2 Satellite from China
mazaj.com.pk/pakistan-achiev…
#PakistanSpaceProgram #EO2Satellite #SUPARCO #EarthObservation #SatelliteLaunch #ChinaSpaceCollaboration #HighResolutionImaging #DisasterManagement #ClimateAnalysis #UrbanPlanning #NationalDevelopment #AstronautTraining #HumanSpaceflightProgram #TiangongSpaceStation #ElectroOpticalSatellite

13

Jan 20
AFRY Contributes Energy Systems and Climate Analysis to Landmark Nobel Center Project news.europawire.eu/afry-supp… #AFRY #EnergySystems #ClimateAnalysis #NobelCenter #Stockholm @AFRY_global

2
78


12 Dec 2025
What will you create using the domain name Climatology.Ai?
Here is an example: 🌦️ Climatology.Ai – Advanced Climate Analysis and Prediction – Discovr.Ai/Climatology-Ai
#ClimatologyAi #WeatherPrediction #ClimateAnalysis #EnvironmentalModeling #DiscovrAi

2

26 Nov 2025
The Rising Climate Risks for India: An Analysis Based on the Climate Risk Index 2026
#CRI2025 #climaterisks #climateanalysis
share.youturn.in/en/articles…
46

23 Oct 2025
As of Oct 23, 2025, the UK Met Office has not attributed the unusual early winter cold in the UK to the north Pacific marine heatwave. #ClimateAnalysis #UKWeather
54
7 Oct 2025
What will you create using the domain name Climatology.Ai?
Here is an example: 🌦️ Climatology.Ai – Advanced Climate Analysis and Prediction – Discovr.Ai/Climatology-Ai
#ClimatologyAi #WeatherPrediction #ClimateAnalysis #EnvironmentalModeling #DiscovrAi

7

25 Sep 2025
ChatGPT, Gemini, DeepSeek, Peplexity, Claude, Grok Prompts for Meteorologist
ismailsaleem.gumroad.com/l/P…
#ChatGPTPromptsForMeteorologists #Meteorology #WeatherForecasting #ClimateAnalysis #WeatherPatterns #SevereWeather #AtmosphericScience #ClimateChange #WeatherModels #MeteorologicalData #WeatherPrediction #StormTracking #TemperatureAnalysis #HumidityLevels #WeatherInstrumentation #ClimateTrends #WeatherReporting #ChatGPT #PromptEngineering #Prompt
39

30 Aug 2025
@OscarsWild1, the interplay between climate phenomena is indeed fascinating. What implications can we draw for future forecasts? ❄️ #ClimateAnalysis
1
1
12
12 Aug 2025
What will you create using the domain name Climatology.Ai?
Here is an example: 🌦️ Climatology.Ai – Advanced Climate Analysis and Prediction – Discovr.Ai/Climatology-Ai
#ClimatologyAi #WeatherPrediction #ClimateAnalysis #EnvironmentalModeling #DiscovrAi

5

25 Jul 2025
MetOp-SG-A1 and Sentinel-5 mission to launch on Ariane 6... Read more: spaceanddefense.io/metop-sg-…
@esa #MetOpSGA1 #Sentinel5 #mission #Ariane6 #satellite #rocket #Spaceport #weatherforecasting #climateanalysis

1
2
4
162

20 Jul 2025
Curious about which city actually feels best year-round in Florida? I ran the numbers—factoring in not just heat but dew points and rainfall. Here’s what I found: #FloridaWeather #FloridaLiving #ClimateAnalysis #BestPlacesToLive medium.com/@alanworldview/wh…
1
1
186
1 Jul 2025
What Will You Create Using This .Ai? 🐋 EEW Ai: Pioneering Environmental Early Warning (EEW) Technology Discovr.Ai/eew-ai #RenewableEnergy #EarlyWarning #Sustainability #EcosystemProtection #GreenTechnology #ClimateAnalysis #EnergyOptimization #EnvironmentalIntelligence

9
25 Jun 2025
What Will You Create Using This .Ai? Climatology AI: Advanced Climate Analysis and Prediction discovr.ai/climatology-ai Climate Change #ArtificialIntelligence #WeatherPrediction #EnvironmentalModeling #ClimateAnalysis #AtmosphericScience #ClimatePatterns #DataAnalytics

9