
🌪️📊📡Atlantic & Pacific Hurricane Season Outlook , Summer and Autumn 2026- (Analog-Based) #North_America #hurricanes.
Much of the current narrative pointing to a weak 2026 hurricane season is driven by social media hype around a “super El Niño,” but this appears temporally misaligned.
The available signals suggest a later ENSO peak toward December, not during the core summer months when Atlantic activity is most affected .
The outlook here is based on a 32-analog ensemble (1860–2025) used to reconstruct 500 hPa patterns, derived from a multivariable statistical framework that integrates multiple sources of climate forcing, offering a more grounded perspective beyond simplified ENSO assumptions.
The large-scale analog signal continues to support a near-normal to slightly above-normal Atlantic hurricane season, despite ongoing narratives of suppression due to a potential El Niño.
Key driver: the expected ENSO peak is late (Dec–Jan) → meaning limited shear impact during the core season (Aug–Sep).
Monthly Evolution (Atlantic & NPA context)
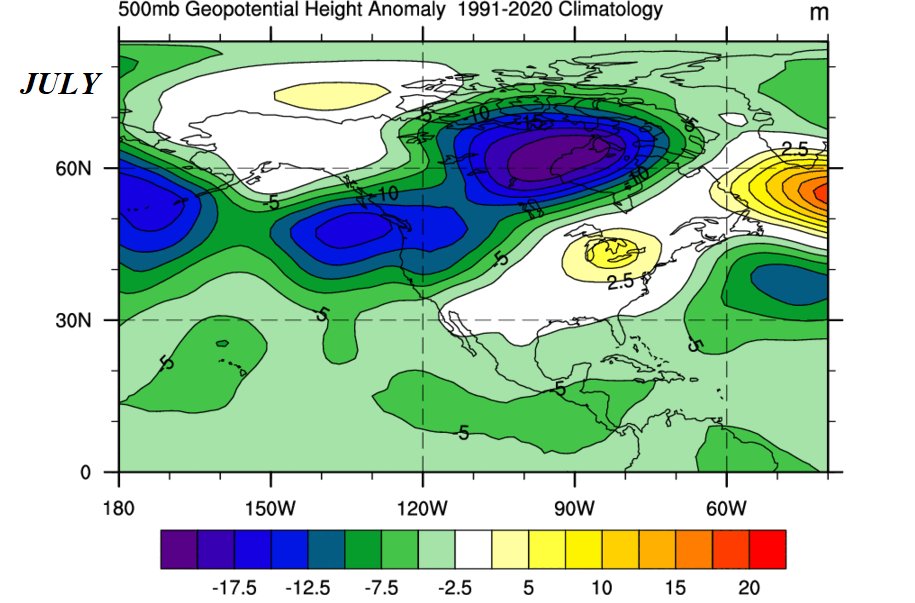
July
NPA: modest troughing, transitional flow
MDR: gradually organizing
Storm zones: Caribbean, W. Atlantic
→ Early-stage activity, not yet dominant
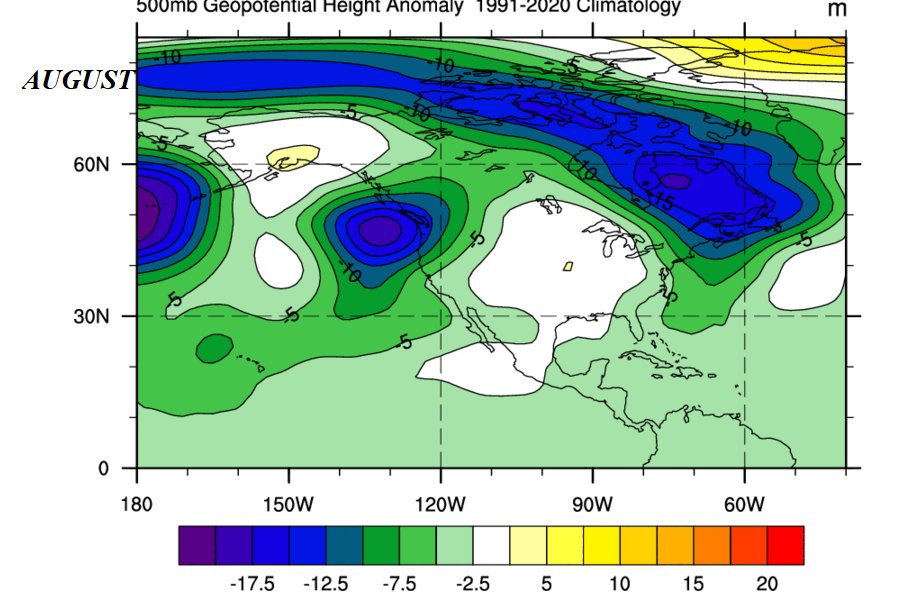
August
NPA: deeper trough into W. North America → reduced Atlantic shear windows
MDR: ridge strengthening, improving wave propagation
Storm zones: MDR → Caribbean → Bahamas
→ Clear ramp-up phase
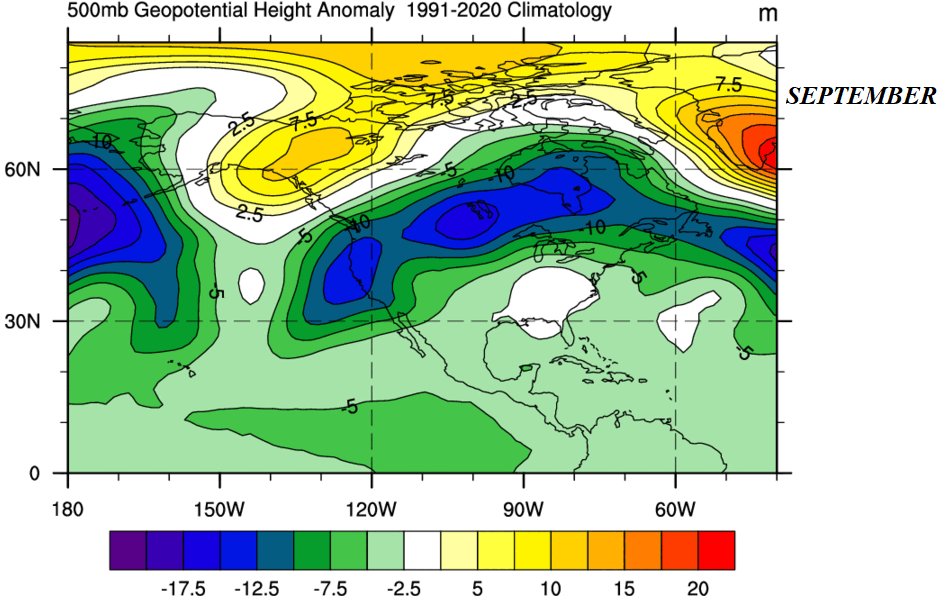
September (Peak)
NPA: structured waveguide, balanced ridge–trough pattern
MDR: fully active, low shear pockets
Storm zones: Cape Verde → long-track hurricanes → W. Atlantic re-curvature
→ ACE peak aligns with climatology
October
NPA: increased trough penetration southward
MDR: weakening, shift westward
Storm zones: Caribbean, Gulf, W. Atlantic
→ Higher land-interaction & hybrid systems
November
NPA: trough-dominated regime
MDR: suppressed, activity contracts
Storm zones: Western Caribbean focus
→ Late-season residual activity
Pacific (Brief)
Eastern Pacific likely near-normal to slightly active early, with activity modulated by evolving ENSO structure
Gradual shift in activity distribution as the season progresses, with less coherent suppression signal than typically assumed
🎯The Punch line :
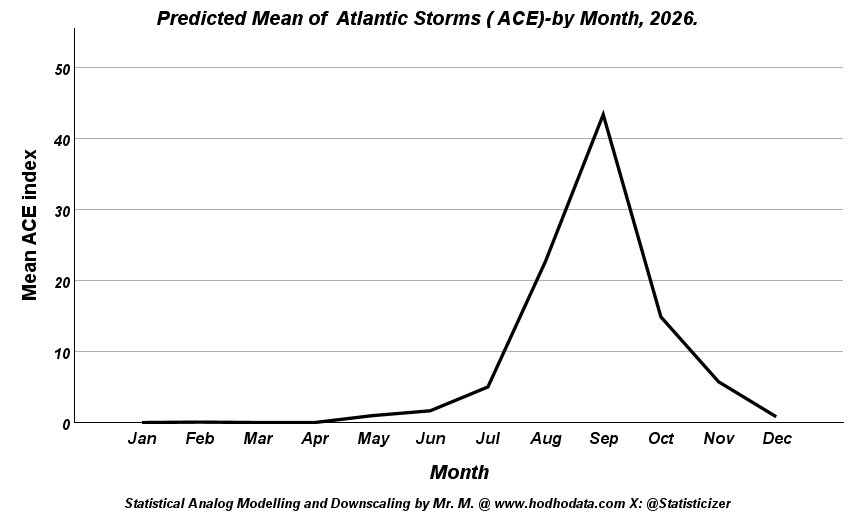
The synoptic evolution ACE analogs closely match climatology, particularly the September peak.
There is no strong signal for a suppressed Atlantic season at this stage. The expected ACE indices sit near the climatological average expected for the like seasons ( neither much less nor much more ) .
If El Niño develops, its main atmospheric imprint is likely delayed into late 2026 and early 2027, not during peak hurricane months.
❗️The October and November expected 500 hpa synoptic maps and storm track detailed monthly interpretation are added in the comments.
Other forecasts for the atlantic region had also been post in the comments-from the last week.
Warmest Regards,
Statistical Analog Modelling & Downscaling By Mr. M @Statisticizer. / hodhodata.com , Irbid -Jordan.
___________________
#AtlanticHurricaneSeason #HurricaneSeason2026 #TropicalCyclones
#ACEIndex #ENSO #ElNino #ClimateSignals
#NorthPacific #MDR #WeatherPatterns
#HurricaneForecast #LongRangeForecast #ClimateAnalysis
#EarlyWarning #DisasterPreparedness
3
7
33
5,756
🌏 #India #Monsoon All-India-Rainfall (AIR) Outlook (April–July) | Interim Prediction. South East Asia Flood Risk predictions 2026 .
This outlook is based on 42 statistical analog seasons, identified using AI (ANN) and advanced statistical modeling applied to long-term climate datasets (ENSO, PDO, Indo-Pacific warming index, and Atmospheric Angular Momentum Plus reconstructed AIR index ) extending back to 1860 . The results represent a probabilistic rainfall pattern, not a deterministic forecast.
🌧️ How to Read the Colors
🟢 Green: Above-average rainfall
🌲 Deep Green: ⚠️ High probability of heavy rainfall / flood risk
⚪ White: Near normal
🟤 Brown: Below-average rainfall (dry conditions)
📅 Temporal Evolution
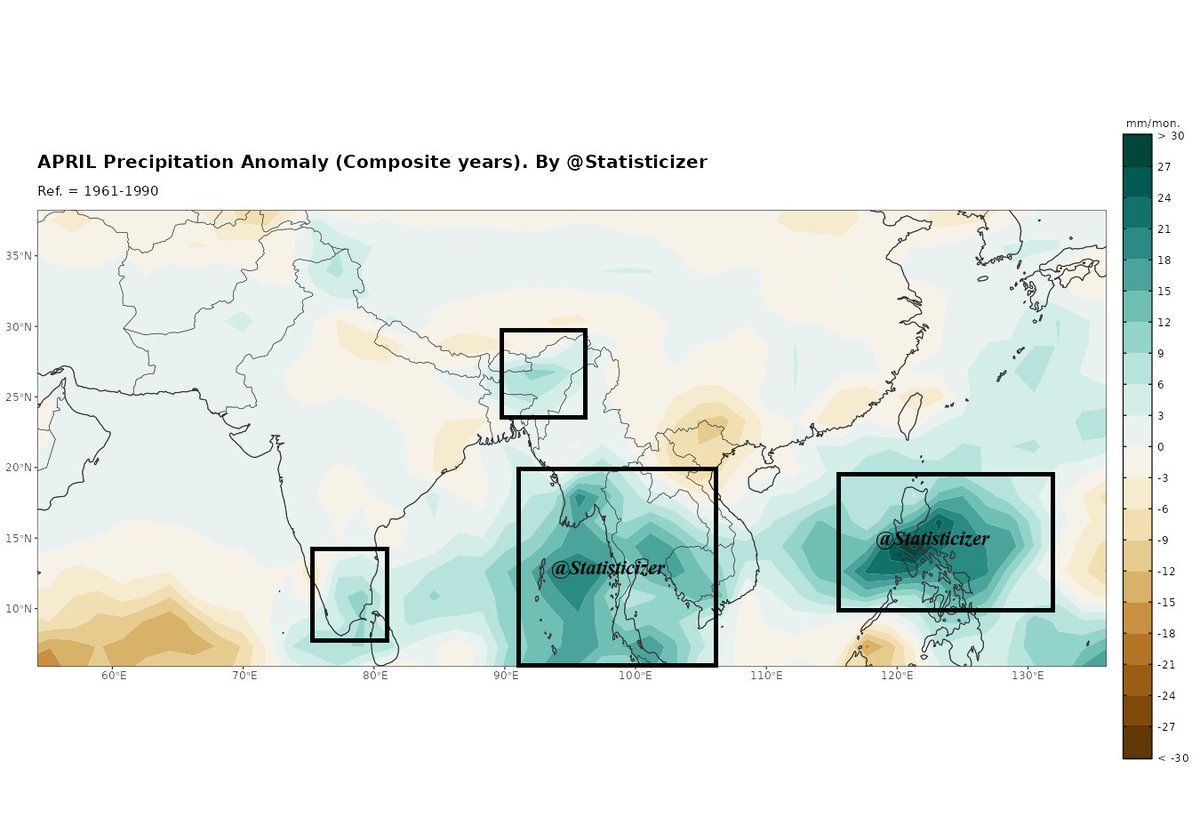
🔹 April (Pre-Monsoon Phase)
Signals remain weak and scattered. Early moisture build-up appears over the southern Bay of Bengal and parts of Southeast Asia, but rainfall is still localized and not fully organized.
🔹 May (Early Organization Phase)
A clear strengthening trend begins:
Eastern India, Bangladesh, and the Bay of Bengal show deep green anomalies
Increasing activity over southern India
➡️ This points to an early organization and strengthening of the monsoon system
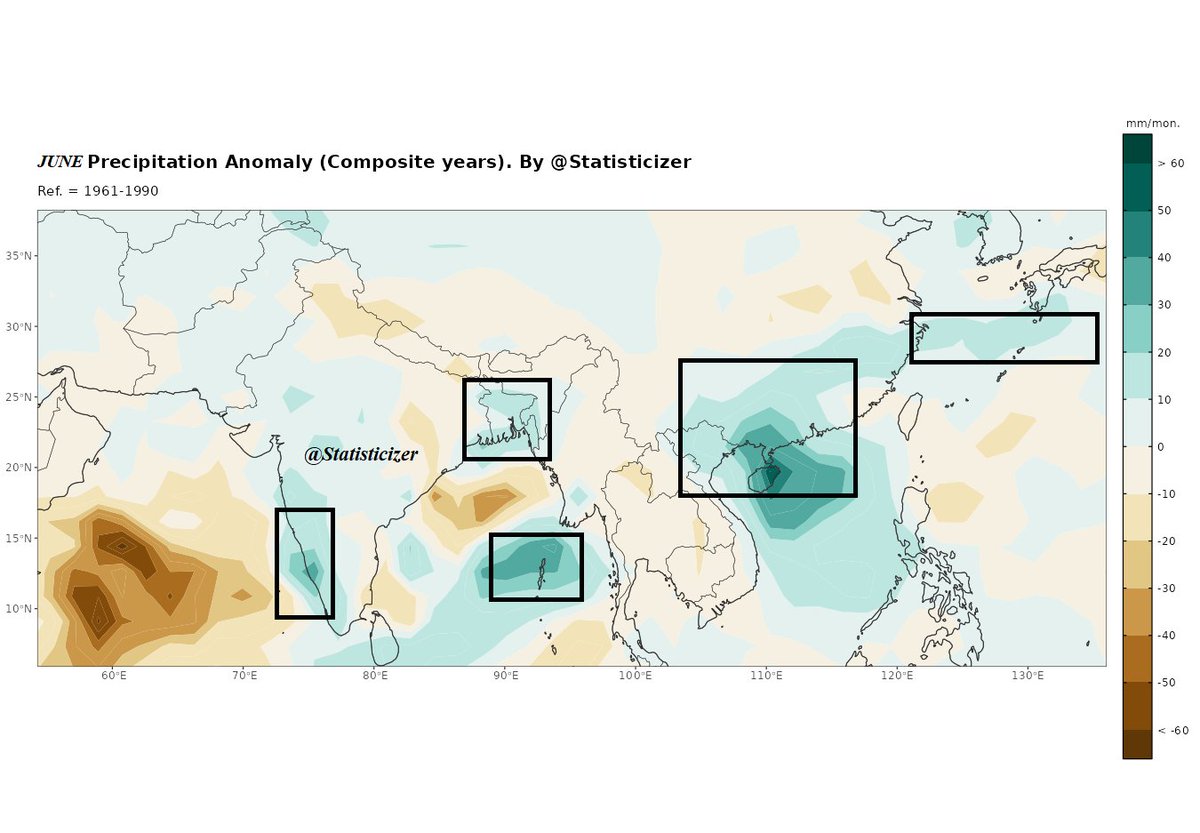
🔹 June (Expansion Phase)
Rainfall becomes more structured and widespread
Strong signals shift toward the Bay of Bengal, eastern India, and Southeast Asia
Parts of central India may experience temporary weakening (break-like phases)
➡️ A developing but regionally uneven monsoon
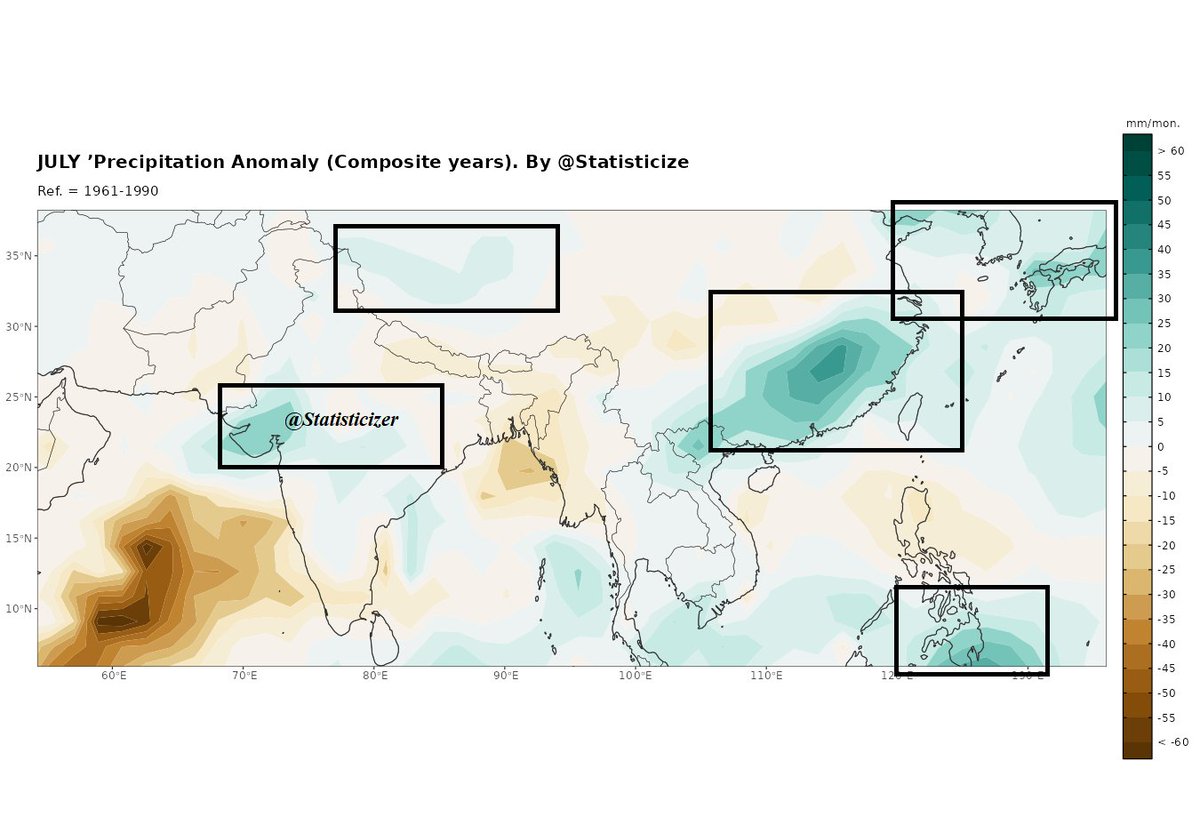
🔹 July (Peak Phase)
Peak monsoon conditions, though less uniform than classic strong years
Stronger anomalies persist over the northern Bay of Bengal and East Asia, while parts of India show mixed signals
➡️ Suggests active pulses rather than continuous widespread rainfall
⚖️ Strengthening vs Weakening Signals
Strengthening:
Early intensification is evident from May into June, especially across eastern sectors (Bay of Bengal, Bangladesh, Northeast India), indicating a front-loaded monsoon development.
Weakening / Redistribution:
By June–July, signals become less consistent over central and western India, suggesting break phases or shifting rainfall corridors rather than uniform coverage.
⚠️ Flood Risk Regions (Highlighted Boxes)
The highlighted regions align with historically flood-prone zones during monsoon surges, especially under deep green anomalies:
Eastern India & Bangladesh → Primary flood hotspot
Bay of Bengal coastal belt → Surge-driven heavy rainfall
Parts of Southeast Asia → Secondary flood risk
Southern Arabian Sea / Southwest India (early phase) → Localized heavy rainfall risk
🌧️ Philippines (Western Pacific / Maritime Continent)
April–May:
Clear green to deep green anomalies → early moisture buildup
➤ Indicates active convection and strong tropical moisture supply
June:
Signals remain strong and organized
➤ A highly energized Western Pacific feeding the monsoon system
July:
Still positive but slightly weaker in some areas
➤ Continued activity with redistribution of rainfall zones
🌧️ South China (Guangdong, Guangxi, South China Sea)
April:
Weak to moderate signals → early-stage development
May:
Strengthening begins, especially toward the South China Sea
June:
Peak signal with strong green anomalies
➤ Consistent with Meiyu / early summer rainband development
July:
Signals persist but become more diffuse and eastward-shifted
➤ Suggests episodic heavy rainfall and shifting rainbelt dynamics
🌲 Key Risk Indicator
Areas showing deep green anomalies should be closely monitored for:
Intense rainfall bursts
River overflow
Flash flooding during peak phases
🔎 Bottom Line
A relatively early strengthening monsoon signal is evident
Rainfall likely peaks during May–June, with shifting intensity into July
Expect episodic heavy rainfall, especially across eastern regions
Flood risk is elevated in key zones during active pulses
This is a pattern-based outlook, and updates closer to the season will refine regional detail.
📢 Kindly share the forecast. Due to time constraints, regional follow-up is prioritized where audience engagement is higher.
Statistical Modelling By: @Statisticizer
The Principal Data Scientist – at Alhodhod Data Analysis Services.
Irbid, Jordan
#IndiaMonsoon #Rainfall #FloodRisk #ClimateAnalysis #Monsoon2026

5
10
77
5,942

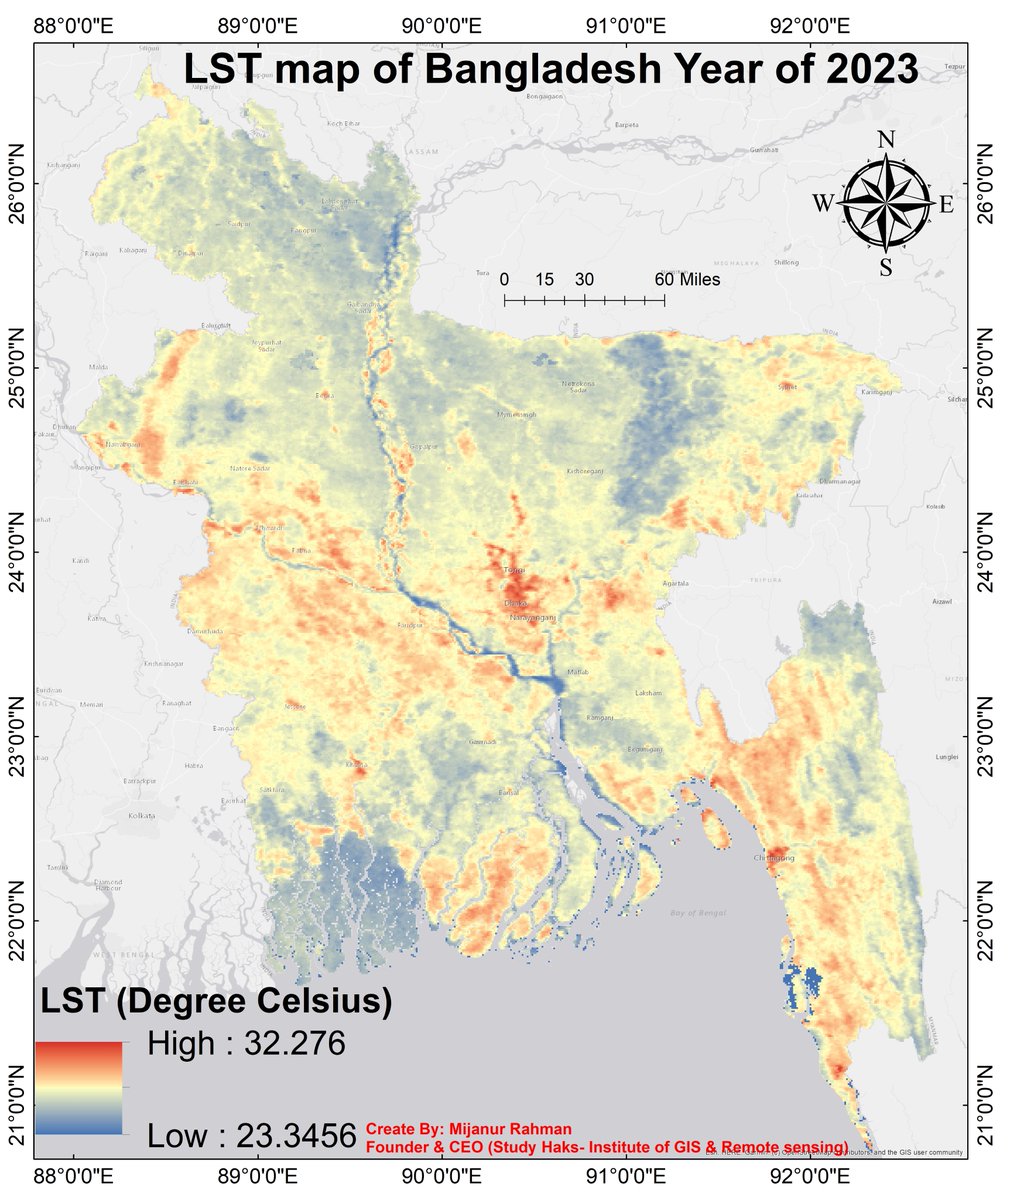
🔥 Can YOU Create a LST Map Like This? 🌡️🇧🇩
Registration info: studyhacksgeospatial.com/goo…
#GoogleEarthEngine #RemoteSensing #GIStraining #ClimateAnalysis #LST #UrbanHeatIsland #MachineLearning #SpatialAnalysis #Geospatial #EnvironmentalScience #StudyHacks #GISRSInstitute
1
19
748

25 Jul 2025
MetOp-SG-A1 and Sentinel-5 mission to launch on Ariane 6... Read more: spaceanddefense.io/metop-sg-…
@esa #MetOpSGA1 #Sentinel5 #mission #Ariane6 #satellite #rocket #Spaceport #weatherforecasting #climateanalysis

1
2
4
162

8 Mar 2025
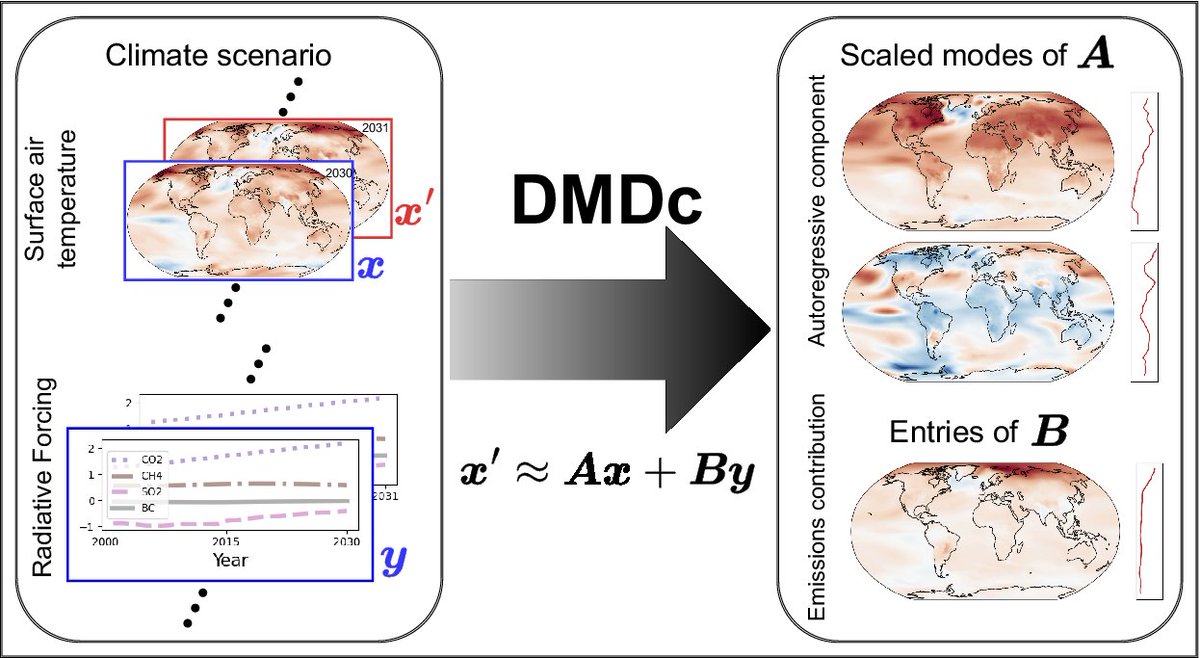
Recently published!
Analyzing climate scenarios using dynamic mode decomposition with control
➡️ bit.ly/41pNej8
By @NateMankovich, @shbouabid, @NowackPeer,
Deborah Bassotto(@isp_uv_es) and Gustau Camps-Valls
#climate #climateanalysis #datascience #climatemodelling
9
29
1,515

20 Nov 2024
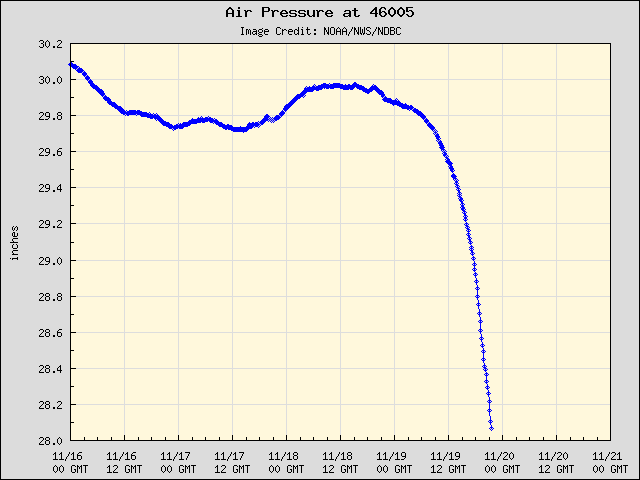
A historic bomb cyclone off the Pacific Northwest has shattered climatological records:
🔹 Pressure drop: Central pressure plunged to 951 mb and was continuing to plummet when a nearby buoy stopped recording; a 61 mb drop in 24 hours was measured at that location — more than double the criteria for bombogenesis
🔹 Rare event: Near -5.5 standard deviations for pressure per NAEFS—a statistical anomaly with a 0.00006% chance of happening
🔹 Climatology record: The cyclone's minimum central pressure set a record for late November in this region
⛈️ Bomb cyclones occur when midlatitude cyclones rapidly intensify (24 mb drop within 24 hours) — this one is rewriting the record books.
What’s next? Powerful atmospheric river impacts persist late this week:
🔹 2-3 standard deviations above normal precipitable water
🔹 Integrated vapor transport (a measure of atmospheric river intensity) is in the 99th percentile for NorCal northward
🔹 High risk for excessive rainfall and heavy mountain snow in the region
#BombCyclone #AtmosphericRiver #ExtremeWeather #ClimateAnalysis #InSpire
ALT A satellite loop of the deepening bomb cyclone off the Pacific Northwest coast. (CIRA)
2
1
8
1,392


10 Jun 2024
Test history free for Basel to explore our new accumulation tool and many other features! meteoblue.com/historyplus #WeatherForecast #ClimateAnalysis
2
1,932


6 Feb 2024
For those of you who are catching up, here’s what we’ve delivered so far:
1. Why we’ve developed the project as the starting point for the design and development of the city.
2. Information on the types of companies we will be investing in; that is, green technologies or technologies that can provide carbon-neutral solutions for the city in combination with others.
3. We will be hiring design and development teams as recommended by Committee members to create the radical designs required to turn space into a technology enhanced, lifestyle promoting city space.
4. The Design of the Project. Now let’s start to get into how each piece will need to work together to achieve our Net-Zero objectives.
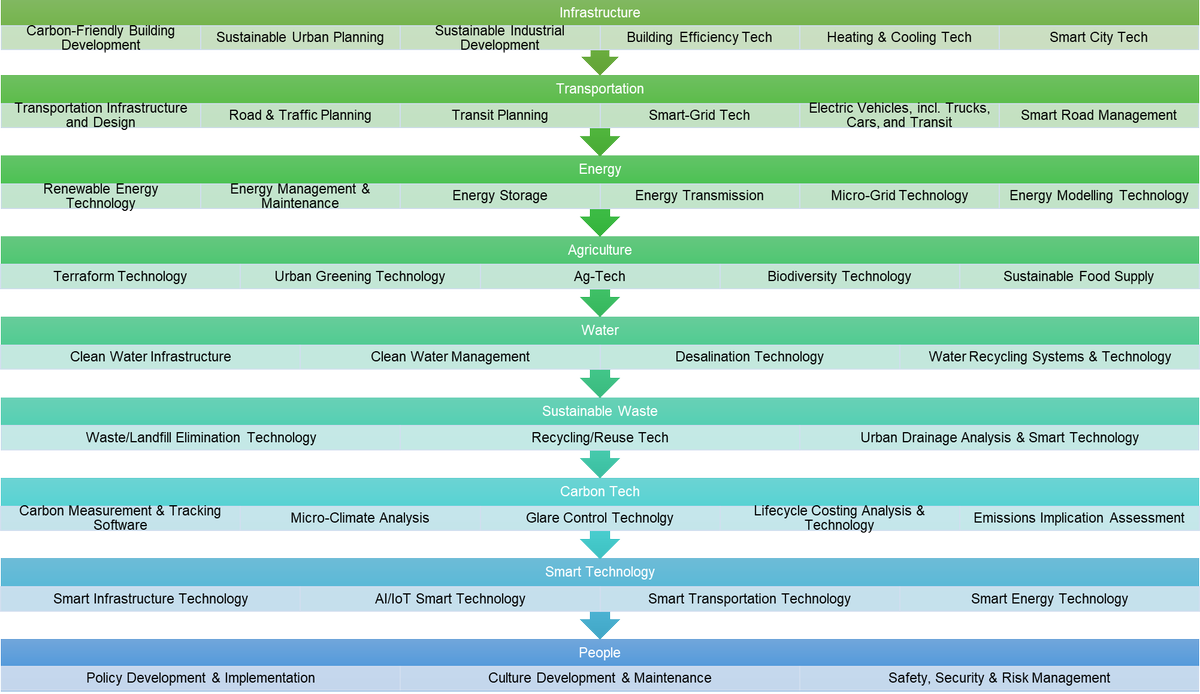
Extensive studies conducted by respected institutions have shown that by building a technology integration system between these five categories, companies can move from theoretical cost reductions to measured results.
By building decarbonization plans backed by legitimate technology pathways, the Net-Zero City Project aims to help corporations reduce their carbon footprint while capitalizing on revenue building opportunities.
We plan to use equity investment to direct resources towards overall profit for each of our partners and the applicants who participate in our Project.
The goal is to start at an NPV of zero when you’re finished developing the property and start making money from there. In a corporate city, taxes go towards the same infrastructure projects, but can also go towards dividend payments to those who invest in its success. Similarly, each of our partners will have the opportunity to gain from participating with us, either through partnerships, developing the Net-Zero City Project, or by acting on one of our committees.
Examples of how various green technologies can be integrated into our structure can be found on our website at netzerocityproject.com/news/…
#agtech #architecture #biodiversity #carboncredits #carbonemissions #carbonneutral #citydevelopment #cityplanning #cleantech #cleanwater #climateanalysis #climatechange #commercialdevelopment #construction #desalination #electricinfrastructure #electricvehicles #energy #energymodelling #energystorage #energytransmission #environment #finance #greeninfrastructure #greentech #greenhousegasemissions #industrial #industrialdevelopment #infrastructure #innovation #invest #investors #microgrid #microhydro #microbiomes #netzero #projectmanagement #realestate #recycling #renewableenergy #smartcities #smartgridtechnology #smarttech #solar #sustainability #technology #transportationdesign #urbandevelopment #urbangreening #urbanplanning
1
2
60
29 Jan 2024
Energy models have shifted as the technology to produce it continues to advance. For existing infrastructure, a hybrid model based on fossil fuels and renewable energy is becoming part of the standard. Is there a combination of technologies that can produce net-zero emissions for a city built from scratch? Theoretical models say yes. What is that combination? For a new city with no energy grid, is using a series of micro-grids more efficient? These, and other questions can be answered collaboratively by assembling a team of experts from every style of energy development.
For the city development plans of the Net-Zero City Project, can water, waste, and other infrastructure contribute to the energy that will be used throughout the city? Can we use geothermal technologies, micro-hydro pumps, biofuel, and other tech to move electricity through the city and use it for different purposes?
As a cornerstone of the Foundational Blocks of city building, and an aspect that nothing else can be built without, facilitating the collaboration of various types of energy generators, storage, maintenance, and tracking will be key to the development of this city.
Further information is available in the application package or on our website at netzerocityproject.com/apply.
Newsletter subscriptions are welcome at varmainc.substack.com.
#agtech #architecture #biodiversity #carboncredits #carbonemissions #carbonneutral #citydevelopment #cityplanning #cleantech #cleanwater #climateanalysis #climatechange #commercialdevelopment #construction #desalination #electricinfrastructure #electricvehicles #energy #energymodelling #energystorage #energytransmission #environment #finance #greeninfrastructure #greentech #greenhousegasemissions #industrial #industrialdevelopment #infrastructure #innovation #invest #investors #microgrid #microhydro #microbiomes #netzero #projectmanagement #realestate #recycling #renewableenergy #smartcities #smartgridtechnology #smarttech #solar #sustainability #technology #transportationdesign #urbandevelopment #urbangreening #urbanplanning
2
1
119
26 Jan 2024
Technology Investment for the Development Sector open.substack.com/pub/varmai…
#agtech #architecture #biodiversity #carboncredits #carbonemissions #carbonneutral #citydevelopment #cityplanning #cleantech #cleanwater #climateanalysis #climatechange #commercialdevelopment #construction #desalination #electricinfrastructure #electricvehicles #energy #energymodelling #energystorage #energytransmission #environment #finance #greeninfrastructure #greentech #greenhousegasemissions #industrial #industrialdevelopment #infrastructure #innovation #invest #investors #microgrid #microhydro #microbiomes #netzero #projectmanagement #realestate #recycling #renewableenergy #smartcities #smartgridtechnology #smarttech #solar #sustainability #technology #transportationdesign #urbandevelopment #urbangreening #urbanplanning
1
1
92

7 Dec 2023
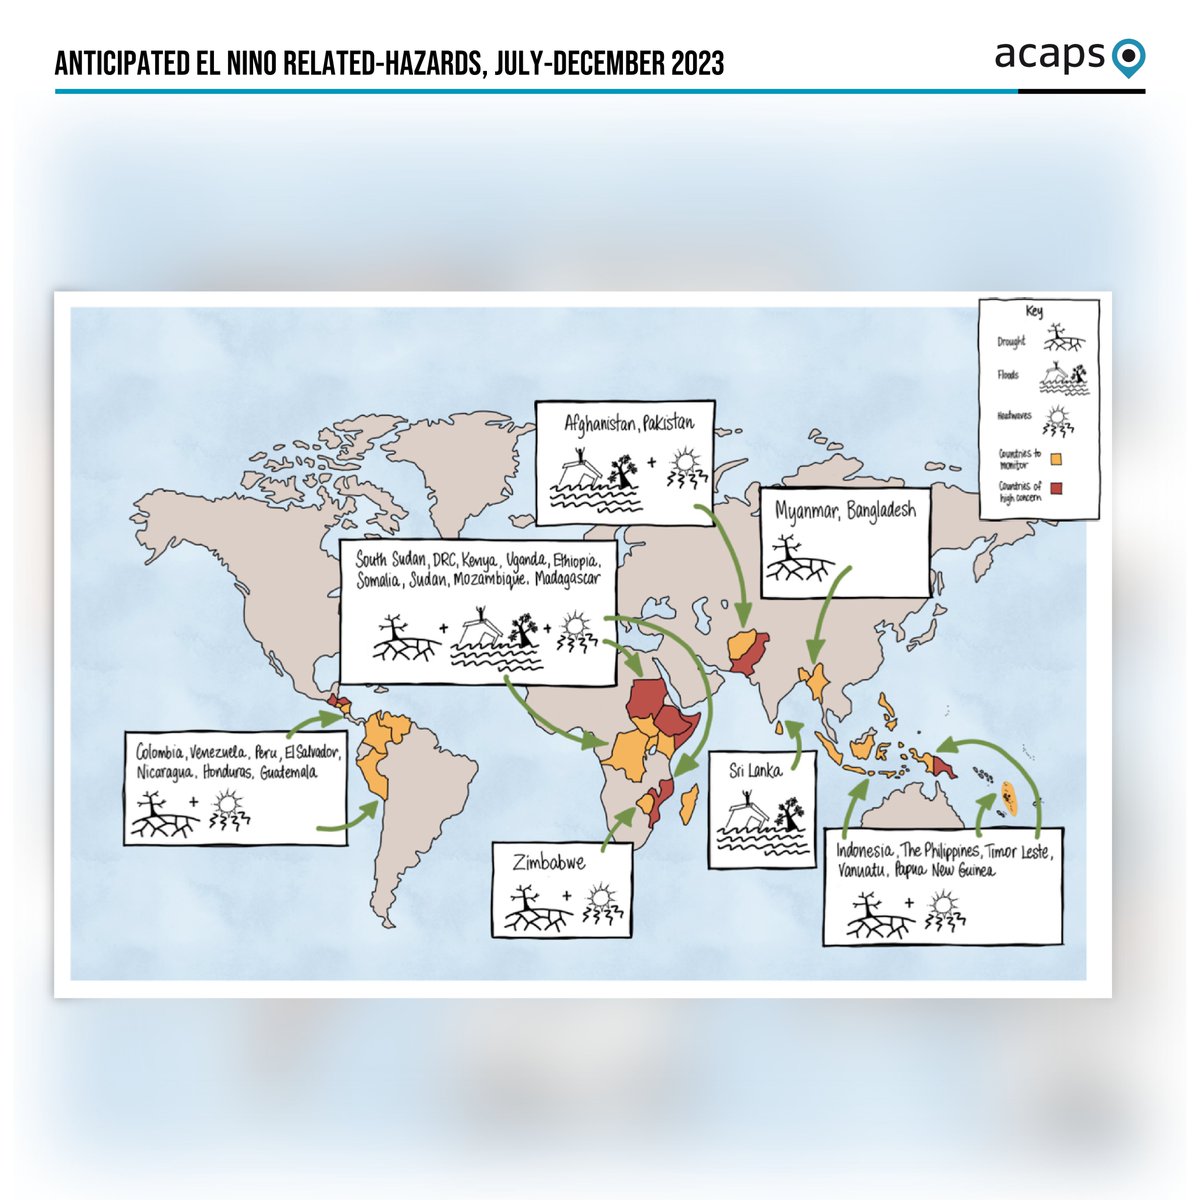
#COP28 | #ClimateAnalysis: based on seasonal forecasts, in 2023, #ElNiño’s impact is expected to be particularly severe in Central America, northern South America, East Asia and the Pacific (dry conditions), and East Africa (both dry and wet conditions)
acaps.org/en/countries/archi…
1
10
9
1,129

1 Dec 2023
As discussions continue at #COP28, the collective focus remains on addressing root causes, fostering global collaboration, and decisive actions to build a sustainable future. 🌐💚 Let's keep the momentum for positive change going! 🤝🌍 #ClimateAnalysis #COP28Insights @NCET_Pak
2
58

6 Nov 2023
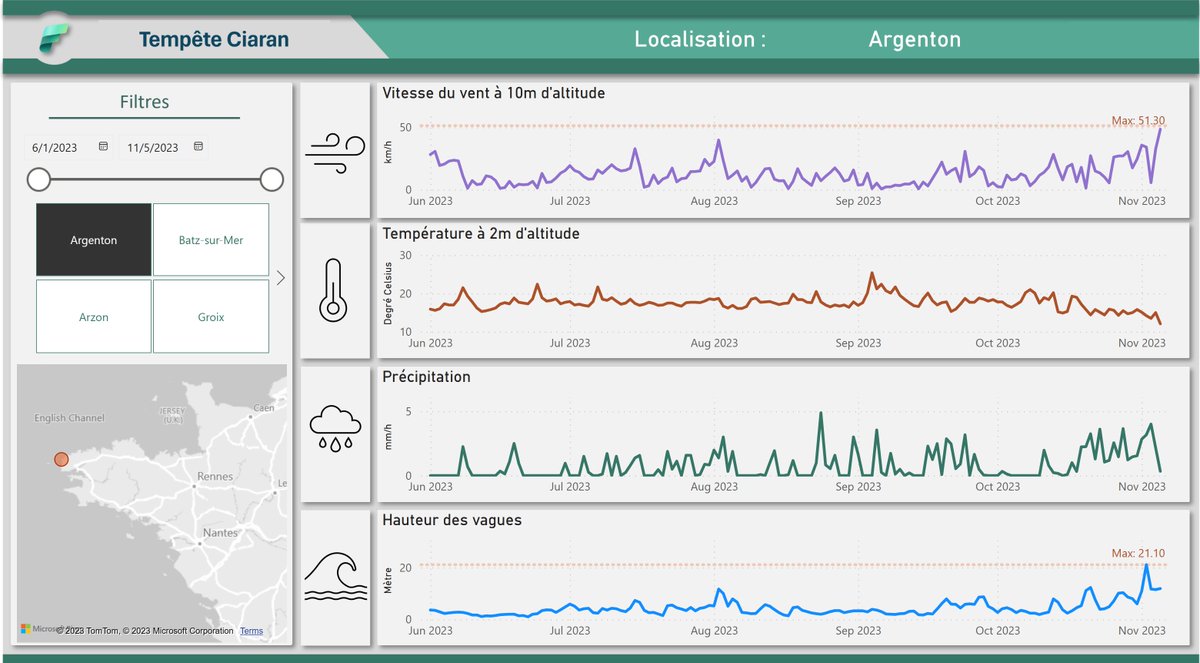
Après la Tempête, place à l'analyse avec Microsoft Fabric ☔🌊🍃 ! Voici mon dernier article : linkedin.com/pulse/analyse-d… @Meteomatics #Weaather #climatechange #climateanalysis #Ciaran #Domingos #msftadvocate #msfabric #microsoftfabric #bretagne
2
3
217

18 Sep 2023
🌍 Climate analysis is the key to informed decisions in Africa. Let's explore how data density can transform the African business landscape.
linkedin.com/pulse/enhancin…
Let's dive in. 🧵
#ClimateAnalysis #AfricanBusiness
1
2
3
67

6 Aug 2023
Our final team training webinar is HERE!
“Integrated Climate Security Analysis”
Time changed from 6:30pm to 7pm
🧿lnkd.in/eefS5GGz
#TeamTraining #webinar #climateanalysis #SaferFuture

2
5
154

26 Jun 2023
#IOPPVSAT17 begins today! Don't miss my talk on Wednesday the 28th, 2023, where I'll be exploring "A Comprehensive Examination of Decomposition Models for Solar Radiation Forecasting in Temperate Climates." #researchtalk #solarresearch #climateanalysis

3
185

17 Nov 2022
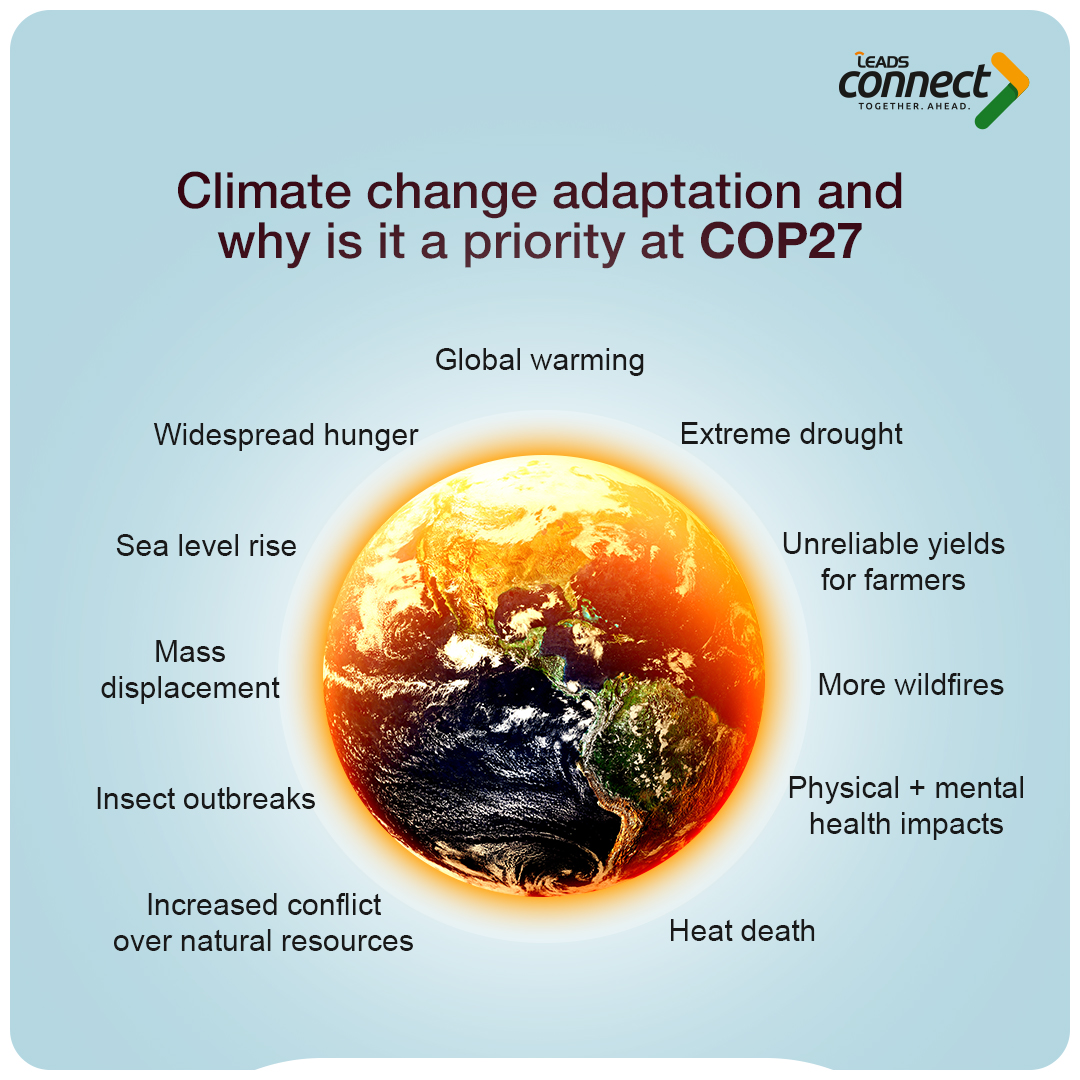
Raising awareness about the climate crisis has been on for a while - it's now time to ACT.
#COP27
#Climate #ClimateChange #ClimateAnalysis #ActOnClimate #ClimateEnergy #ClimateEmergency #LeadsConnect
1
2