

A stock up 8% on normal volume? Could reverse in 10 minutes.
The same stock up 8% on 6x average volume? That move has real participation behind it.
Relative volume is how you tell the difference. Here's how to read it 👇
daytradingtoolkit.com/beginn…
#RelativeVolume #DayTrading
10

この記事では、出来高急増中のAI関連株として注目したい5銘柄と、TradingViewを使った資金流入の見方を初心者向けに解説します。
#出来高急増株 #AI関連株 #米国株 #TradingView #RelativeVolume
web-matsutaka.com/ai-stocks-…
1
47

May 1
Relative Volume Pressure Map [AGPro Series]
Volume is most useful when it is compared to context.
Relative Volume Pressure Map [AGPro Series] highlights unusual activity, pressure zones, and reaction quality so participation becomes easier to read.
tradingview.com/script/495WB…
#TradingView #RelativeVolume #AGProLabs
33
May 1
Volume is most useful when it is compared to context.
Relative Volume Pressure Map [AGPro Series] highlights unusual activity, pressure zones, and reaction quality so participation becomes easier to read.
tradingview.com/script/495WB…
#TradingView #RelativeVolume #AGProLabs
29
Apr 27
## 37. Relative Volume Pressure Map [AGPro Series]
Volume is most useful when it is compared to context.
Relative Volume Pressure Map [AGPro Series] highlights unusual activity, pressure zones, and reaction quality so participation becomes easier to read.
tradingview.com/script/495WB…
#TradingView #RelativeVolume #AGProLabs
45


Наверное это уже про то,как мы"транслируем" наши чувства.Ну то есть "чувствовать гнев" или "раздражение" это зашебись,а вот как ты его "транслировать на других умеешь",это типа другое и другая работа над собой.Но далее"психологи"будут втирать про то,что "подавлять"нельзя и т п🙈
2
39

8 Dec 2025
الفرق بين Volume و Relative Volume ولماذا الثاني أهم في المضاربة
youtube.com/shorts/k3EAetidJ…
في هذا المقطع نشرح الفرق بين Volume و Relative Volume وأهميتهما في السوق الأمريكي.
فهم Relative Volume يساعدك على اكتشاف الأسهم ذات التحركات غير الاعتيادية بسرعة.
لمزيد من التحليل اليومي: balmohsin.com/
خدماتنا:
باقة البث التفاعلي للأسهم الأمريكية: balmohsin.com/livestream/
دورة تعلم تداول الأسهم الأمريكية من الصفر: balmohsin.com/stockscourse/
#تداول_أسهم #StockMarket #RelativeVolume #السوق_الأمريكي #InvestSmart

2
4
324


3 Dec 2025
this tells you everything you need to know about the state of crypto right now - everyone is shitting their pants with every down move #sol #relativevolume

1
26

20 Oct 2025
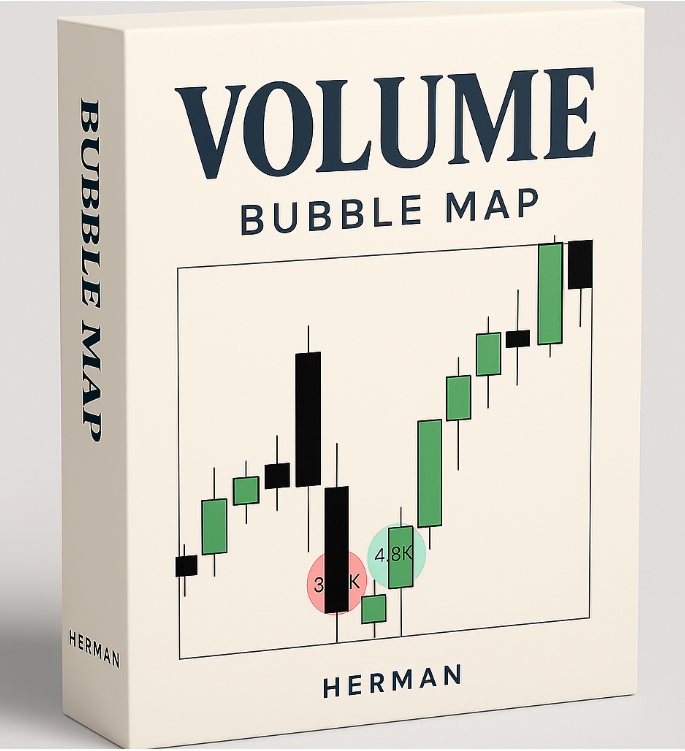
🚀 NEW FREE INDICATOR RELEASED
Volume Bubble Map [Herman] is now live on TradingView
It detects high-volume anomalies (with Alerts) — moments where activity stands out statistically (σ deviation).
The bigger the bubble, the stronger the relative volume strength compared to recent bars.
👉 Try it now:
🔗 tradingview.com/script/oi1tB…
⚠️ Not Bookmap — this is TradingView’s visual take on relative volume dynamics, not real orderflow data.
#TradingView #Volume #VolumeAnalysis #RelativeVolume #Scalping #DayTrading #FuturesTrading #Orderflow #SmartMoney #ICT #FVG #Liquidity #PriceAction #Trader #TradingTools #TechnicalAnalysis #HermanTrading #VolumeProfile #MarketStructure #Backtesting #NasdaqFutures #NQ #Herman #DataDrivenTrading
9
13
98
10,488

26 Sep 2025
"So given that it's a Friday and we're heading into the weekend, even if ES breaks about above IR, the upside could be capped by the 6726.75-3732.25 area and it's questionable whether buyers will have risk appetite to continue buying above that zone.
And because IR is today's BCZ, sellers can be active there as well...and remember that our STB is Neutral, so we have to be flexible to the market moving in either direction."
1st test of today's IR and HPT hit. FT is now flexible between the 6716.25-6723.75 and 6726.75-6723.25 zones. ON High broken for ES, but still waiting to see if NQ breaks in sync as well
Early in the session with lots of relative volume and range to go. Either way, profitable day!
#RelativeVolume
#NeutralSTB
#ImJustHappyMyScaleTargetWasHit
1
42

15 Sep 2025
$RR 64 million shares trading her at 3:30pm.
~16.5% #shortinterest
4.12x #RelativeVolume
#CallFlow on multiple strikes / expiries
#Breakout on the daily of prior #Resistance
#OptionsSellingInstitute
#UnusualOptionsActivity

1
9
674

3 Sep 2025
$AIHS – What Makes This Trade Great!!
To Subscribe: go.trade-ideas.com/SHQ#Tradi…, #GoNoGoCharts, #StockMarket, #TradeIdeas, #BarrieEinarson, #TechnicalAnalysis, #DayTrading, #MomentumTrading, #SwingTrading, #VWAP, #OpeningRangeBreakout, #RelativeVolume, #RiskManagement,
3
216

25 Mar 2025
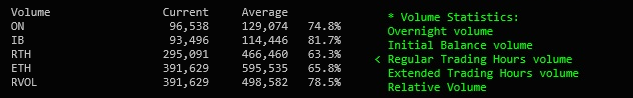
Unleash the power of #MGIStats. Gain insight into trading volume across RTH/ETH, overnight, & #InitialBalance. Elevate your analysis with #RelativeVolume - see just how engaged market participants are in real time
TrinitasTrading.com/mgi-stat…
#MarketInsights #MarketAnalysis $ES $NQ
96

4 Mar 2025
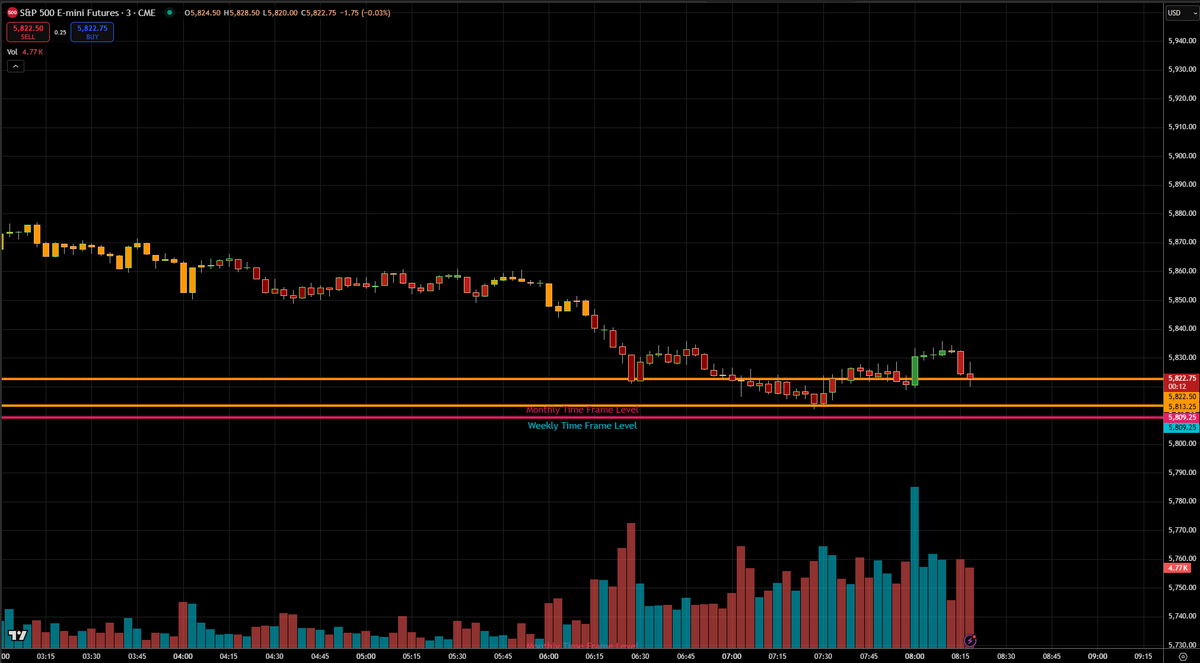
***RTH 3/4/2025 Trading Plan***
Trade Plan
✅ Short Setup (Preferred)
Ideal short entry: 5830-5835 (if price pulls back)
Target 1: 5809-5812
Target 2: 5772-5775 if sellers maintain pressure
Stop Loss: 5842-5845
⚠ Long Setup (High Risk)
Buyers must reclaim 5835 and hold above to trigger a long setup. A strong reclaim could push price toward 5845-5850. No longs unless buyers show clear defense at 5809-5812.
What Happens Next?
📌 Scenario 1 (Most Likely): A weak bounce into 5830-5835, leading to another leg lower toward 5809-5812.
📌 Scenario 2 (Less Likely): Buyers reclaim 5835, leading to a squeeze into 5845-5850.
Key Levels to Watch
🔹 5830-5835 → Ideal short zone (if bounce)
🔹 5809-5812 → Key support
🔹 5772-5775 → Lower target zone
🔹 5845-5850 → Bullish reclaim level
#ES_F #ESFutures #Stocks #daytrading #SPX #SPY #Futures #FOREX #WallStreet #NQ #SP500Futures #DayTrading #FuturesTrading #StockMarket #TradingStrategy #PriceAction #TechnicalAnalysis #MarketProfile #OrderFlow #VolumeAnalysis #Scalping #SwingTrading #OpeningRangeBreakout #RiskManagement #TradeSetup #LiquidityZones #MarketTrends #ADXAnalysis #RelativeVolume #EminiTrading #TradingPsychology #ChartPatterns #SupportAndResistance #ProfessionalTrader #TradeIdeas #MarketRecap
21
4 Mar 2025
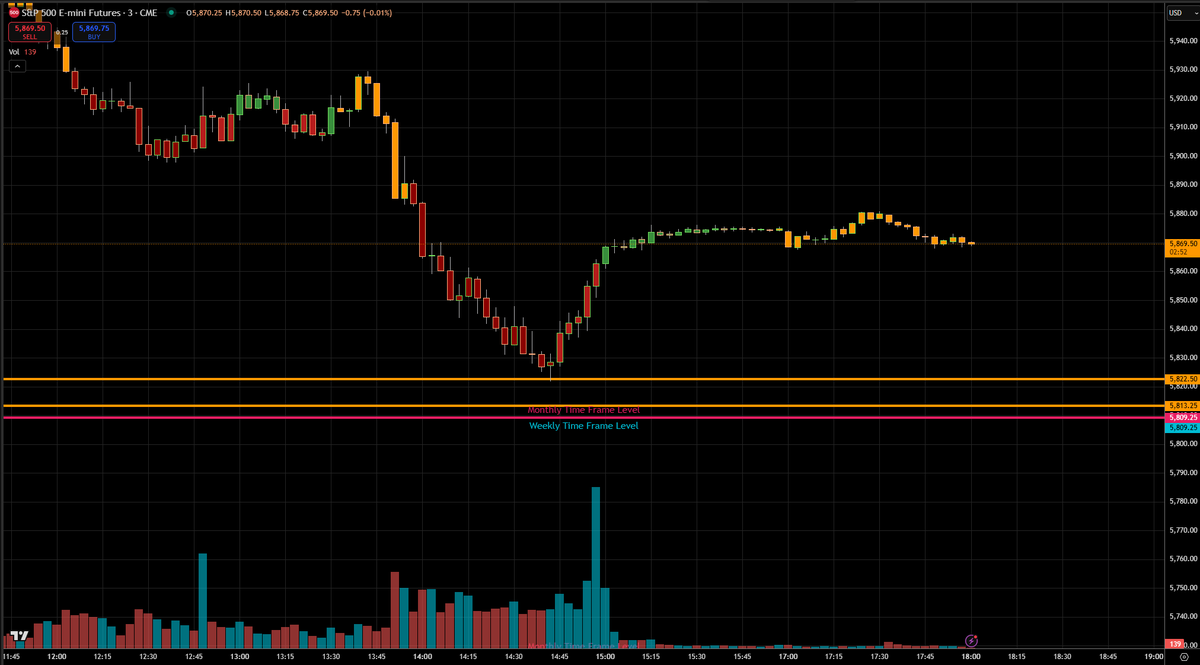
***ETH 3/3/2025 Trading Plan***
✅ Short Setup (Preferred)
Ideal short entry: 5875-5882 (if price pulls back)
Target 1: 5842-5845
Target 2: 5825-5830 if sellers maintain pressure
Stop Loss: 5885-5888
⚠ Long Setup (High Risk)
Buyers must reclaim 5882 and hold above to trigger a long setup. A strong reclaim could push price toward 5929. No longs unless buyers show clear defense at 5842-5845.
What Happens Next?
📌 Scenario 1 (Most Likely): A weak bounce into 5875-5882, leading to another leg lower toward 5842-5845.
📌 Scenario 2 (Less Likely): Buyers reclaim 5882, leading to a squeeze into 5929.
Key Levels to Watch
🔹 5875-5882 → Ideal short zone (if bounce)
🔹 5842-5845 → Key support
🔹 5825-5830 → Lower target zone
🔹 5929 → Bullish reclaim level
#ES_F #ESFutures #Stocks #daytrading #SPX #SPY #Futures #FOREX #WallStreet #NQ #SP500Futures #DayTrading #FuturesTrading #StockMarket #TradingStrategy #PriceAction #TechnicalAnalysis #MarketProfile #OrderFlow #VolumeAnalysis #Scalping #SwingTrading #OpeningRangeBreakout #RiskManagement #TradeSetup #LiquidityZones #MarketTrends #ADXAnalysis #RelativeVolume #EminiTrading #TradingPsychology #ChartPatterns #SupportAndResistance #ProfessionalTrader #TradeIdeas #MarketRecap
27
3 Mar 2025
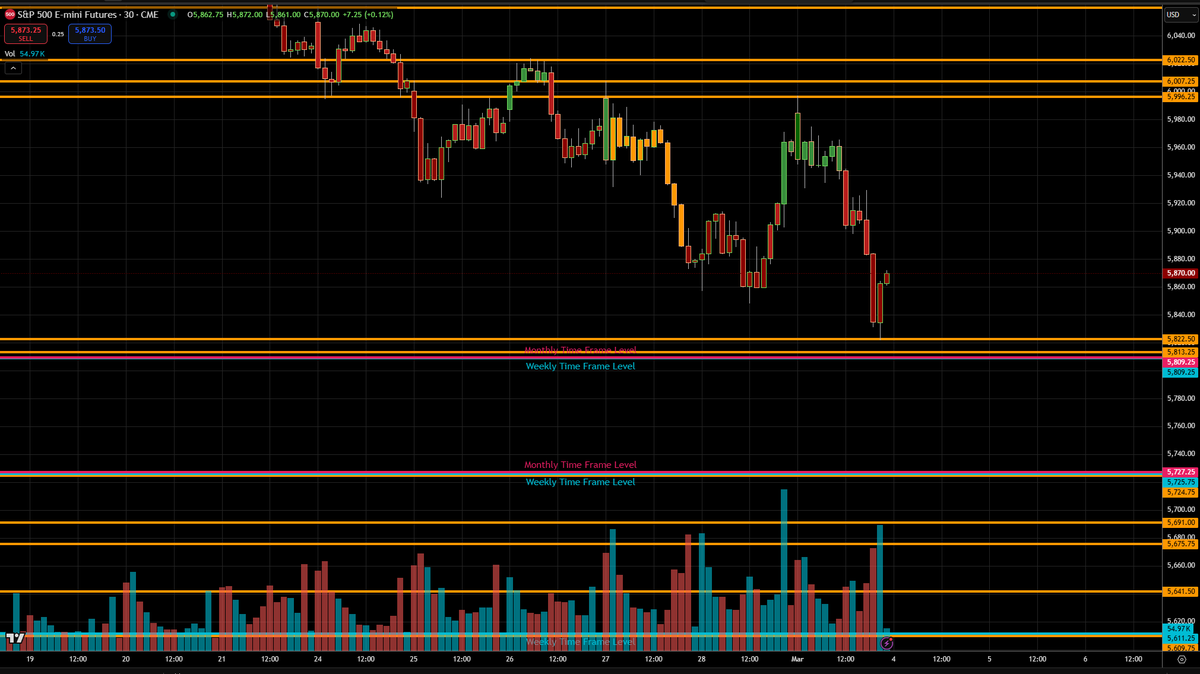
***3/3/2025 Daily ES Recap***
Market Context & Price Action
Today's session in S&P 500 E-mini Futures (ES) saw continued downward pressure as price tested major support levels, with buyers attempting to stabilize price action into the close.
Early Session Weakness: ES opened with selling pressure, quickly breaking below 5,900 and testing the critical 5,870-5,860 support zone.
Sellers controlled momentum, driving price toward 5,842-5,813, where a reaction was expected.
Midday Reversal Attempt: Buyers stepped in around the 5,813-5,809 weekly demand zone, leading to a short-lived bounce.
However, retests of 5,870-5,880 failed to hold, signaling weak buying conviction.
Afternoon Selloff & Close Near Lows: The late session saw another wave of selling pressure, briefly breaking below 5,860 before finding support.
Price stabilized near 5,870 but remains vulnerable to a deeper test of key lower supports.
Key Support & Resistance Levels
Support Levels:
5,870-5,860 – Holding for now, but any failure could send price toward 5,813-5,809 (Weekly Support).
5,813-5,809 – Major Weekly Demand Zone; critical for bulls to defend.
5,775-5,750 – Deeper support if the current demand fails.
Resistance Levels:
5,900-5,910 – First upside barrier for any recovery attempt.
5,950-5,970 – Major resistance and rejection zone from recent price action.
6,007-6,022 – Key upside breakout zone if price can reclaim lost ground.
Outlook for the Next Session
Bullish Scenario: If ES holds 5,870-5,860, a bounce could retest 5,900-5,910 and possibly extend toward 5,950-5,970.
Bearish Scenario: A breakdown below 5,860 could trigger a flush toward 5,813-5,809, with further downside risks if that level fails.
📌 Key Takeaway:
Today’s session showed continued selling pressure, with ES testing weekly demand levels near 5,813-5,809. Holding this zone is critical for bulls to stage a recovery, while a failure could lead to another leg down toward 5,775-5,750.
#ES_F #ESFutures #Stocks #daytrading #SPX #SPY #Futures #FOREX #WallStreet #NQ #SP500Futures #DayTrading #FuturesTrading #StockMarket #TradingStrategy #PriceAction #TechnicalAnalysis #MarketProfile #OrderFlow #VolumeAnalysis #Scalping #SwingTrading #OpeningRangeBreakout #RiskManagement #TradeSetup #LiquidityZones #MarketTrends #ADXAnalysis #RelativeVolume #EminiTrading #TradingPsychology #ChartPatterns #SupportAndResistance #ProfessionalTrader #TradeIdeas #MarketRecap
37